

DMTN-334
Characterizing Memory Requirements for Large-Scale LSSTCam Productions at FrDF#
Abstract
This technical note analyzes memory-usage patterns of pipetask during large-scale LSSTCam production campaigns at CC-IN2P3 (FrDF). We compare four campaigns (DM-53368, DM-53719, DM-53877, DM‑54249 ) that employed four different software-stack releases: w_2025_48, v30.0.0rc2, v30.0.0 (rc3), and v30.0.4. The results indicate that, for the majority of tasks, a memory budget of 6 GB per core is sufficient, with only a small fraction of quanta exceeding this threshold. Consequently, reducing the per‑core RAM from the current 10 GB to 6 GB appears feasible and could generate significant cost savings.
Characterizing Memory Requirements for Large-Scale LSSTCam Productions at FrDF#
Introduction#
The purpose of this technical note is to study the memory usage patterns of pipetask to assess future RAM requirements for worker nodes. Currently, worker nodes are provisioned with 10 GB of memory per core for machines on lsst partition and 4GB of memory per core for machine on standard partition. Analyzing metrics from recent large-scale tests at CC-IN2P3 can provide valuable insight into whether reducing the memory per core to 6 GB would be both feasible and cost-effective.
We analyzed memory-usage metrics collected by the Butler for five large-scale test campaigns at the French Data Facility (FrDF - CC-IN2P3):
Campaign |
Software stack |
Visits |
Fields |
|---|---|---|---|
DM‑53368 |
|
4 721 |
WIDE, DDF, COSMOS, M49 |
DM‑53719 |
|
1 061 |
COSMOS, EDFS |
DM‑53877 |
|
1 067 |
COSMOS, EDFS |
DM‑54249 |
|
1 067 |
COSMOS, EDFS |
DM‑54372 |
|
2038 |
SV225 |
The fields have been selected according to the campaign Management (CM) team’s recommendations to cover regions that could pose challenges for data processing, or at least present more significant issues compared to a wide field. Details on the fields are available in offfcial LSST documentation ([Guy et al., 2026],[AlSayyad and O'Mullane, 2026]).
DM‑53368 is a large‑scale test that suffered hardware failures, resulting in incomplete Stage 4 metrics. DM‑53719 and DM‑53877 are pilot runs for the upcoming DP2 production at USDF.
DM‑53877 encountered an issue with a pipetask and was terminated at step 4a.
DM‑54372 is a dense field and will be analyzed in the annex to compare its memory requirements with those of standard fields.
All the campaigns described in the table above have been executed at CC-IN2P3. For this analysis, we will focus on the last campaign executed with v30.0.4, but we will provide a comparison of each campaign in the annex.
The campaigns have been submitted from the CC-IN2P3 using BPS and Panda, with data from the dp2_prep butler as input. The input collection was created using the provided CM scripts and selecting the appropriate visits and exposures via ConsDB.
The scripts to execute the campaigns have been generated from templates using a set of scripts available on CC_IN2P3 Gitlab. For each stage, the metrics are extracted directly from the butler using scripts available in GitHub modified for our scope. And then, the analysis of these metrics is performed stage by stage using Jupyter notebooks.
Our goal is to determine whether a 6 GB / core threshold would be sufficient.
Analysis and Results#
We analyze each campaign stage-by-Stage.
To demonstrate the improvements introduced in version 30, we present a comparative analysis of Stage 1 for of all the stacks in the following figure. However, we will now focus exclusively on data from the DM-54249 campaign based on the v30.0.4 release and we included the comparison between stacks in the annexes.
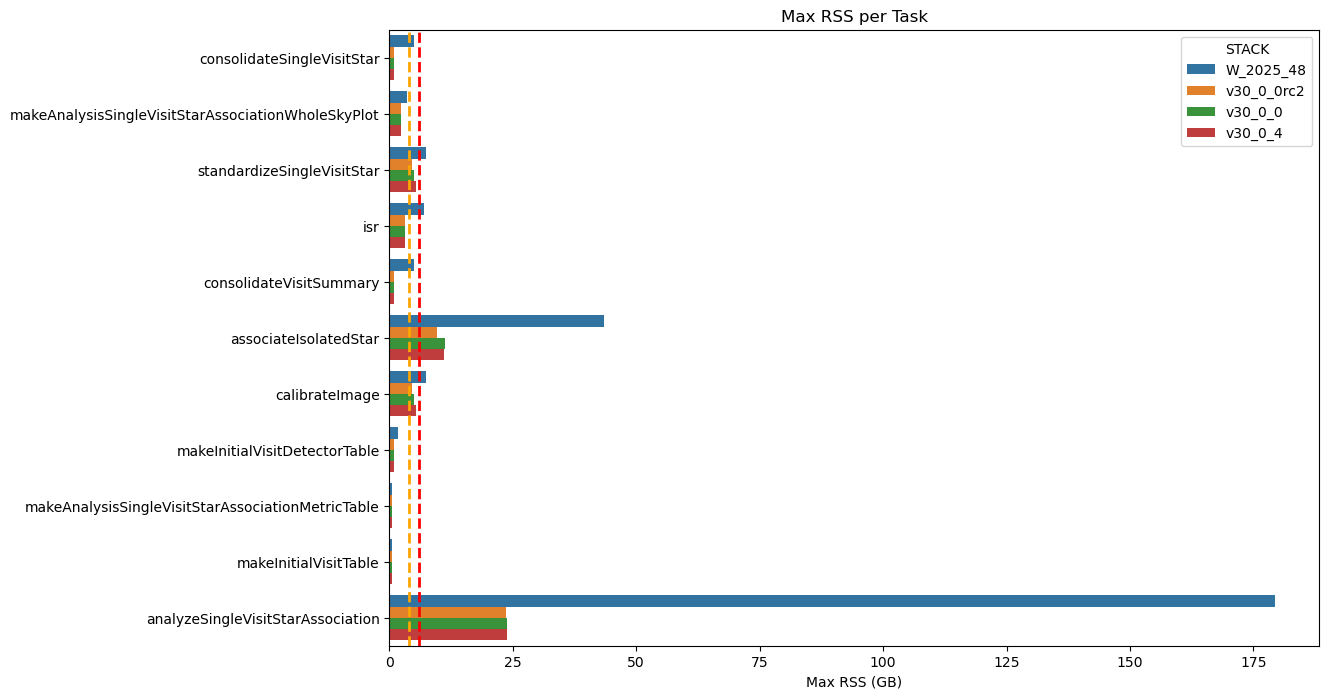
Fig. 1 Maximum RSS of Stage 1 Pipetasks Across Four Stack Releases The plot compares the maximum RSS of the Stage 1 pipetask across four software stack releases. The orange and red dashed lines represent the 4GB and 6GB memory thresholds, respectively. The chart clearly demonstrates a significant improvement in memory usage from the older “weekly” stack to the v30 version.#
A few words about the nomenclature: in the following pages and charts, we refer to each pipetask execution interchangeably as ‘quanta’ or ‘runs’.
Stage 1#
The figure below shows the RSS distribution for each pipetask in Stage 1, confirming that almost all of them run below the 6 GB threshold.
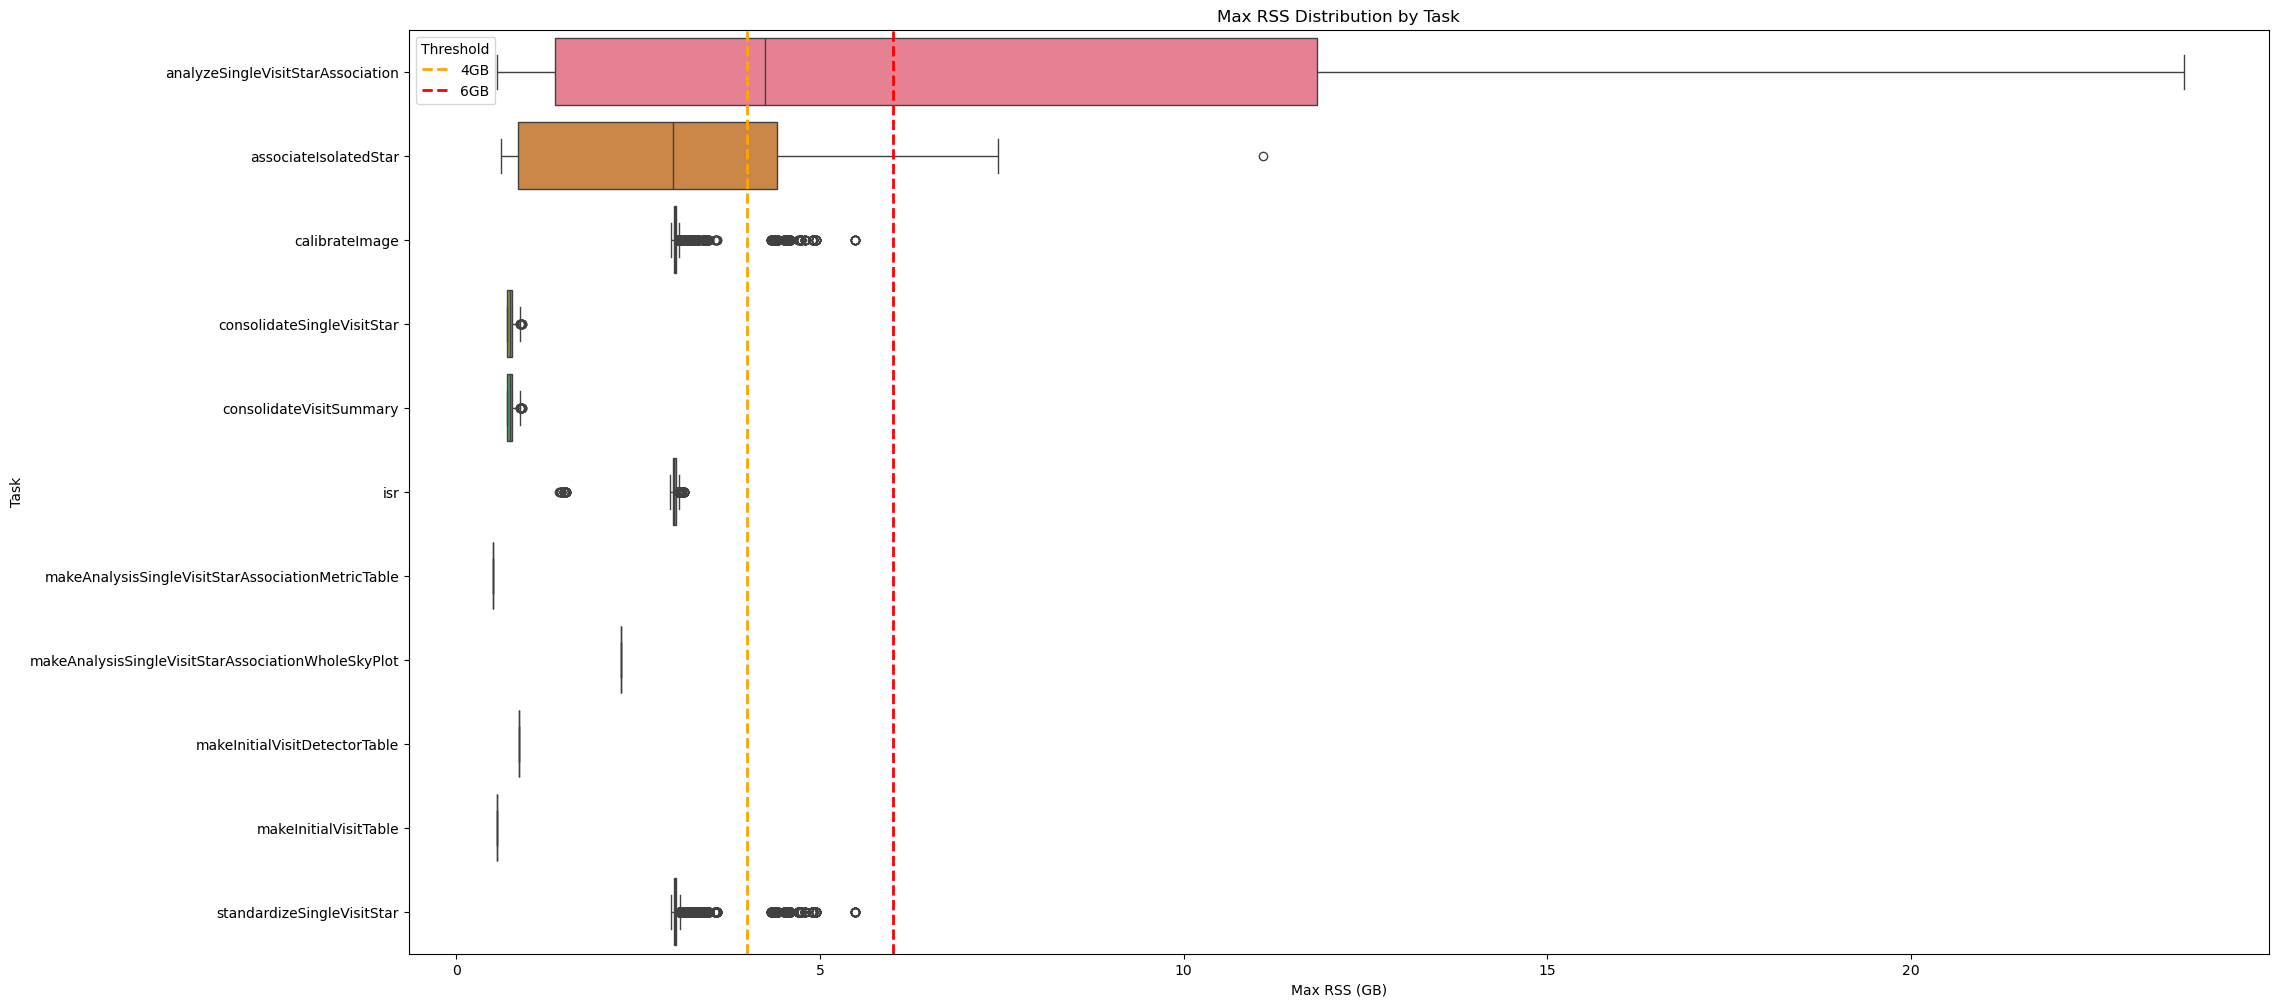
Fig. 2 Box plot showing maximum RSS for Stage 1 pipetasks in DM‑54249 (v30.0.4) release.
Orange and red dashed lines indicate 4GB and 6GB memory thresholds.
Almost all tasks require <6GB RSS, except analyzeSingleVisitStarAssociation.#
The following chart shows the quanta for pipetasks that exceed the 6 GB threshold, weighted by wall-time. For Stage 1, the few outliers (analyzeSingleVisitStarAssociation and associatesIsolateleStar) have a negligible impact on wall-time; this will be discussed further below.
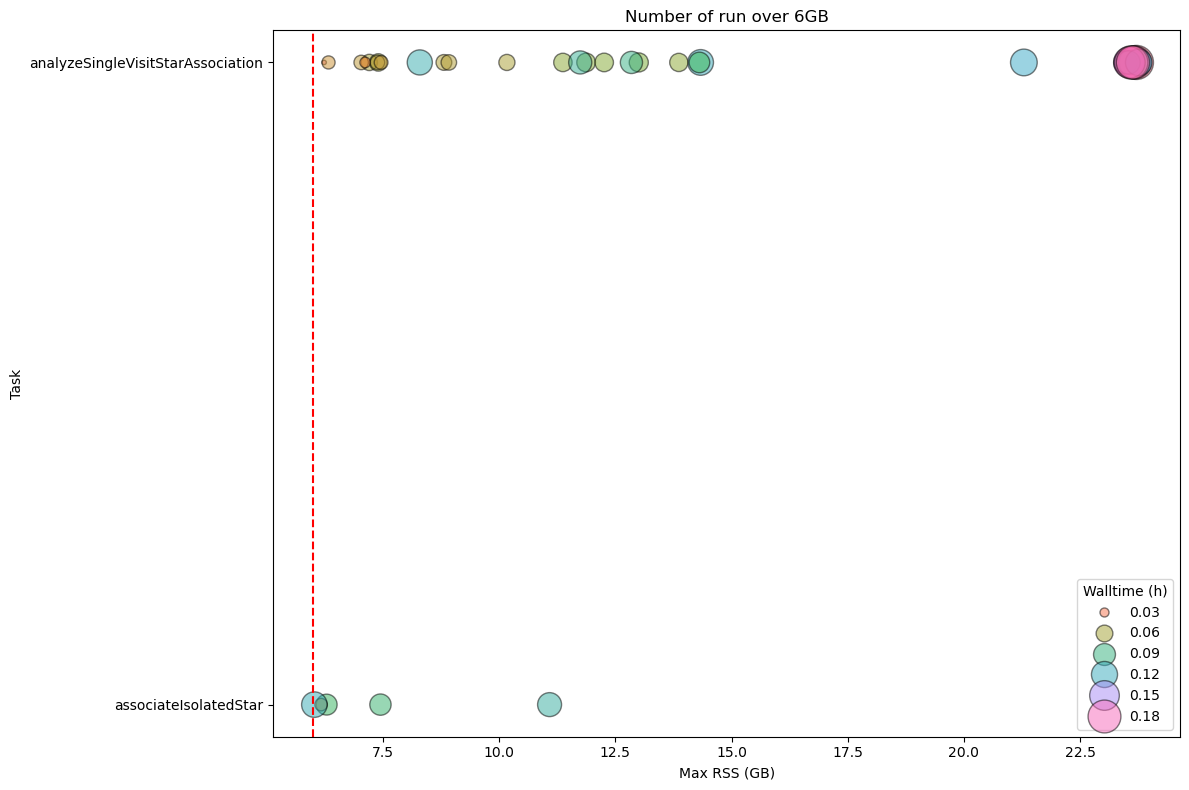
Fig. 3 Stage 1 Pipetask Runs Exceeding the 6 GB Memory Threshold – Frequency and Wall‑time Impact The plot displays the number of runs (quanta) per Stage 1 pipetask that exceed the 6 GB memory threshold (dashed red line). Each circle marks the frequency (i.e., the number of quanta) at which a given task reaches a specific memory level. The size of the circle is proportional to the wall-time of the quanta, showing that the impact on the cores mobilised to handle the memory excess is limited.#
To summarize the RSS usage, the main statistics for Stage 1 are listed in the following table.
max_rss_mean |
max_rss_median |
max_rss_min |
max_rss_max |
max_rss_95th_percentile |
|
|---|---|---|---|---|---|
analyzeSingleVisitStarAssociation |
7.602 |
4.24253 |
0.562172 |
23.7612 |
23.6281 |
associateIsolatedStar |
2.93676 |
2.98122 |
0.609653 |
11.0854 |
6.13378 |
calibrateImage |
3.01213 |
3.00333 |
2.95538 |
5.47653 |
3.06223 |
consolidateSingleVisitStar |
0.741334 |
0.737282 |
0.689316 |
0.907547 |
0.832429 |
consolidateVisitSummary |
0.741334 |
0.737282 |
0.689316 |
0.907547 |
0.832429 |
isr |
2.99997 |
2.99674 |
1.41269 |
3.13416 |
3.0571 |
makeAnalysisSingleVisitStarAssociationMetricTable |
0.508282 |
0.508282 |
0.508282 |
0.508282 |
0.508282 |
makeAnalysisSingleVisitStarAssociationWholeSkyPlot |
2.26377 |
2.26377 |
2.26377 |
2.26377 |
2.26377 |
makeInitialVisitDetectorTable |
0.864044 |
0.864044 |
0.864044 |
0.864044 |
0.864044 |
makeInitialVisitTable |
0.559509 |
0.559509 |
0.559509 |
0.559509 |
0.559509 |
standardizeSingleVisitStar |
3.01989 |
3.00393 |
2.95538 |
5.47653 |
3.06758 |
The next two charts depict the RSS distribution, binned in 1 GB intervals, for every quanta processed during Stage 1. In total, 574 472 quanta were examined, of which only 36 (≈ 0.006 %) surpassed the 6 GB memory threshold.
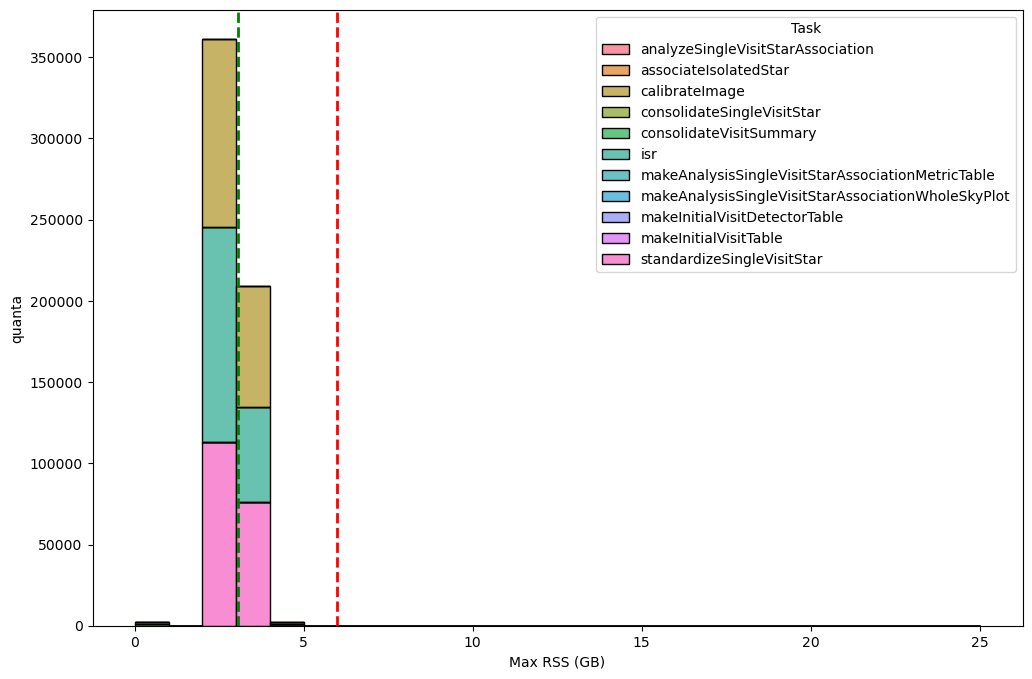
Fig. 4 Distribution of the maximum RSS per pipetask for the DM‑54249 (v30.0.4) Stage 1 run. Histogram bars are grouped in 1‑GB bins. The green dashed line marks the 95th‑percentile of the RSS values (95 % of pipetasks lie at or below this level), while dashed orange and red lines indicate the 4 GB and 6 GB memory thresholds, respectively; tasks above the 6GB threshold may need further optimisation or additional resources. Overall, 574 472 quanta were examined, of which only 36 (≈ 0.006 %) exceed the 6 GB limit.#
The majority of these exceeding quanta are attributed to the analyzeSingleVisitStarAssociation pipetask as visible in the next chart using logaritmic scale to improve the visualization of the outlier .
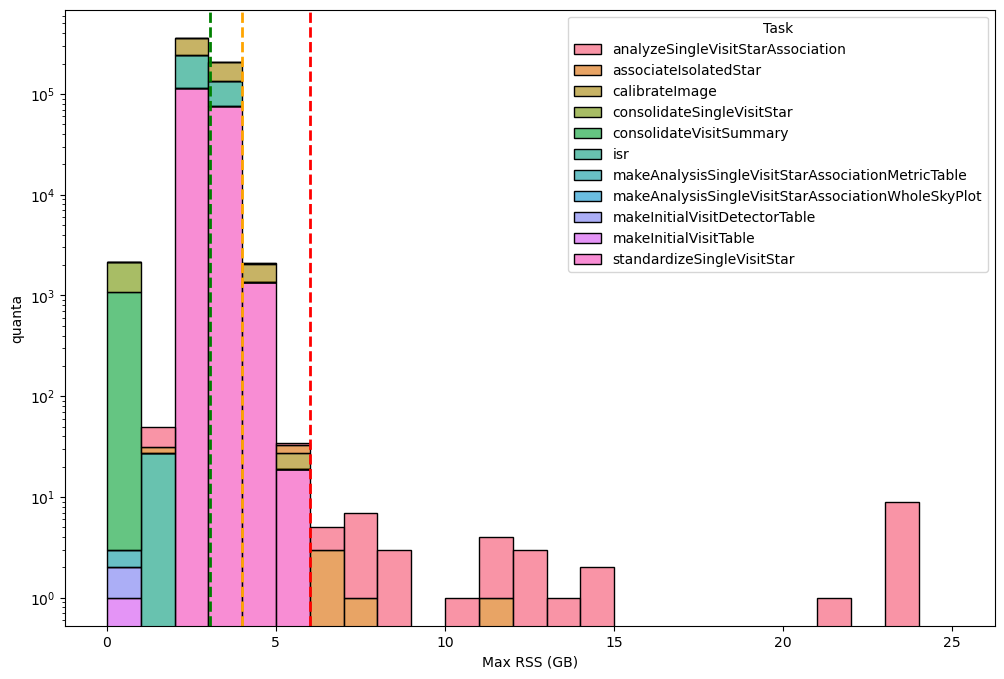
Fig. 5 Distribution of the maximum RSS per pipetask for the DM‑54249 (v30.0.4) Stage 1 run (logaritmic scale). Histogram bars are grouped in 1‑GB bins. The green dashed line marks the 95th‑percentile of the RSS values (95 % of pipetasks lie at or below this level), while dashed orange and red lines indicate the 4 GB and 6 GB memory thresholds, respectively; tasks above the 6GB threshold may need further optimisation or additional resources. Overall, 574 472 quanta were examined, of which only 36 (≈ 0.006 %) exceed the 6 GB limit.#
In the next two figures we incorporate wall-time as a weighting factor (i.e., the total wall‑time summed for all tasks whose peak RSS falls within each defined memory‑usage interval) to better reflect the core‑hours required to satisfy the memory demand of each pipetask, and to highlight the memory regimes that dominate the overall runtime.
It further confirms that 6 GB per core is generally sufficient for almost all Stage 1 pipetasks. In fact, the tasks that require more than 6 GB of RSS account for only ≈ 3.3 hours of wall‑time, compared with the 10 050 hours of total wall‑time for the entire Stage 1 run.
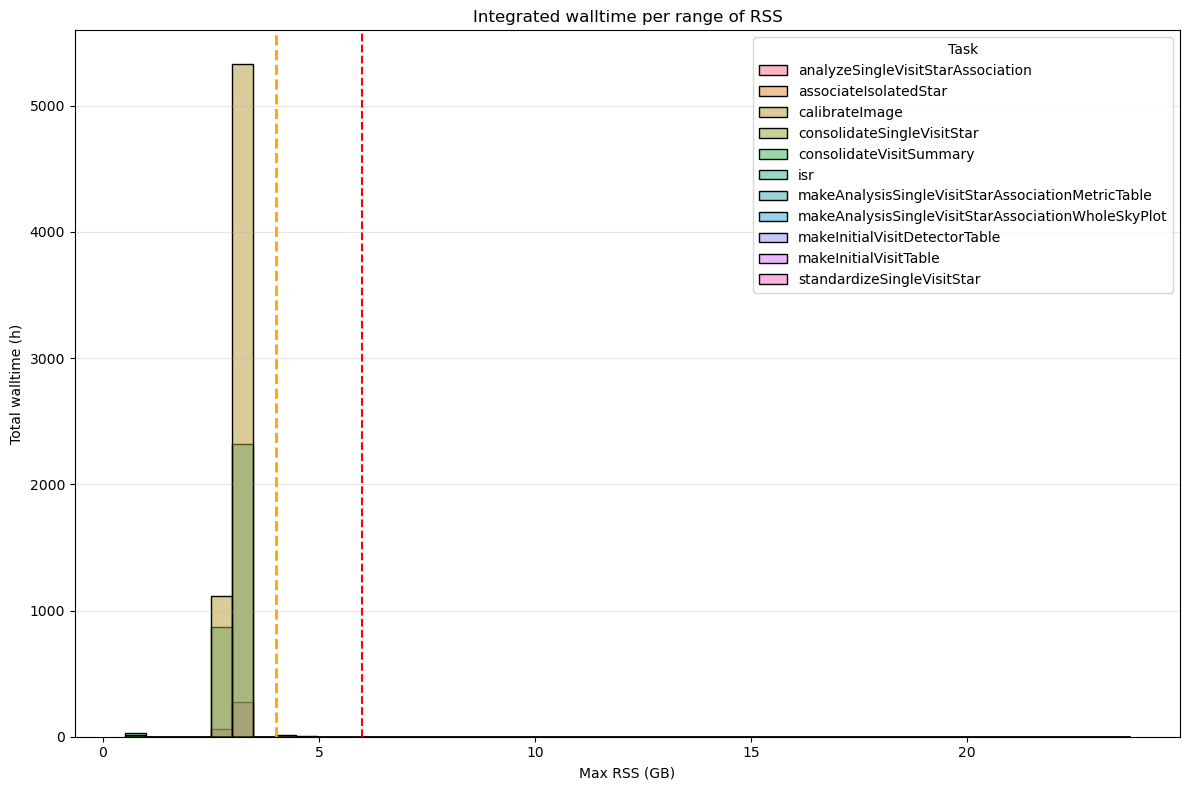
Fig. 6 Integrated wall-time per RSS range for for the DM‑54249 (v30.0.4) Stage 1 processes. Dashed orange and red lines indicate the 4 GB and 6 GB memory thresholds, respectively. Tasks that exceed 6 GB of RSS account for a total of 3 hours of wall-time compared to the 10 050 hours of total wall-time.#
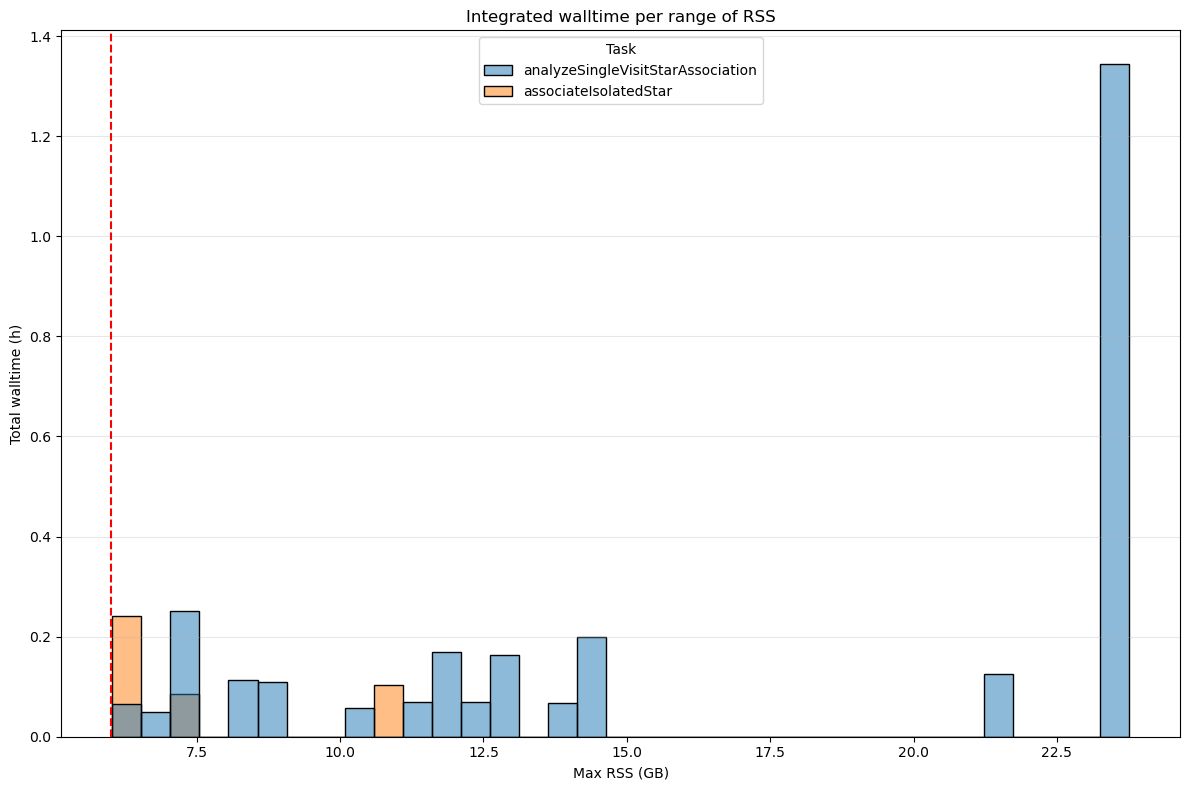
Fig. 7 Integrated wall-time per RSS range for for the DM‑54249 (v30.0.4) Stage 1 processes depassing 6GB. Dashed orange and red lines indicate the 4 GB and 6 GB memory thresholds, respectively. Tasks that exceed 6 GB of RSS account for a total of 3 hours of wall-time compared to the 10 050 hours of total wall-time.#
Stage 2#
Even in Stage 2, the count of pipetasks that exceed the 6 GB limit suggests that a 6 GB‑per‑core allocation is generally sufficient. However, when the wall‑time required to run those over‑threshold tasks is examined, a single pipetask (gaussianProcessesTurbulenceFit) alone consumes ≈ 25 % of the total wall‑time, revealing a non‑negligible problem. This points will be described in details below.
The figure below shows the RSS distribution for each pipetask in Stage 2, confirming that almost all of them run below the 6 GB threshold.
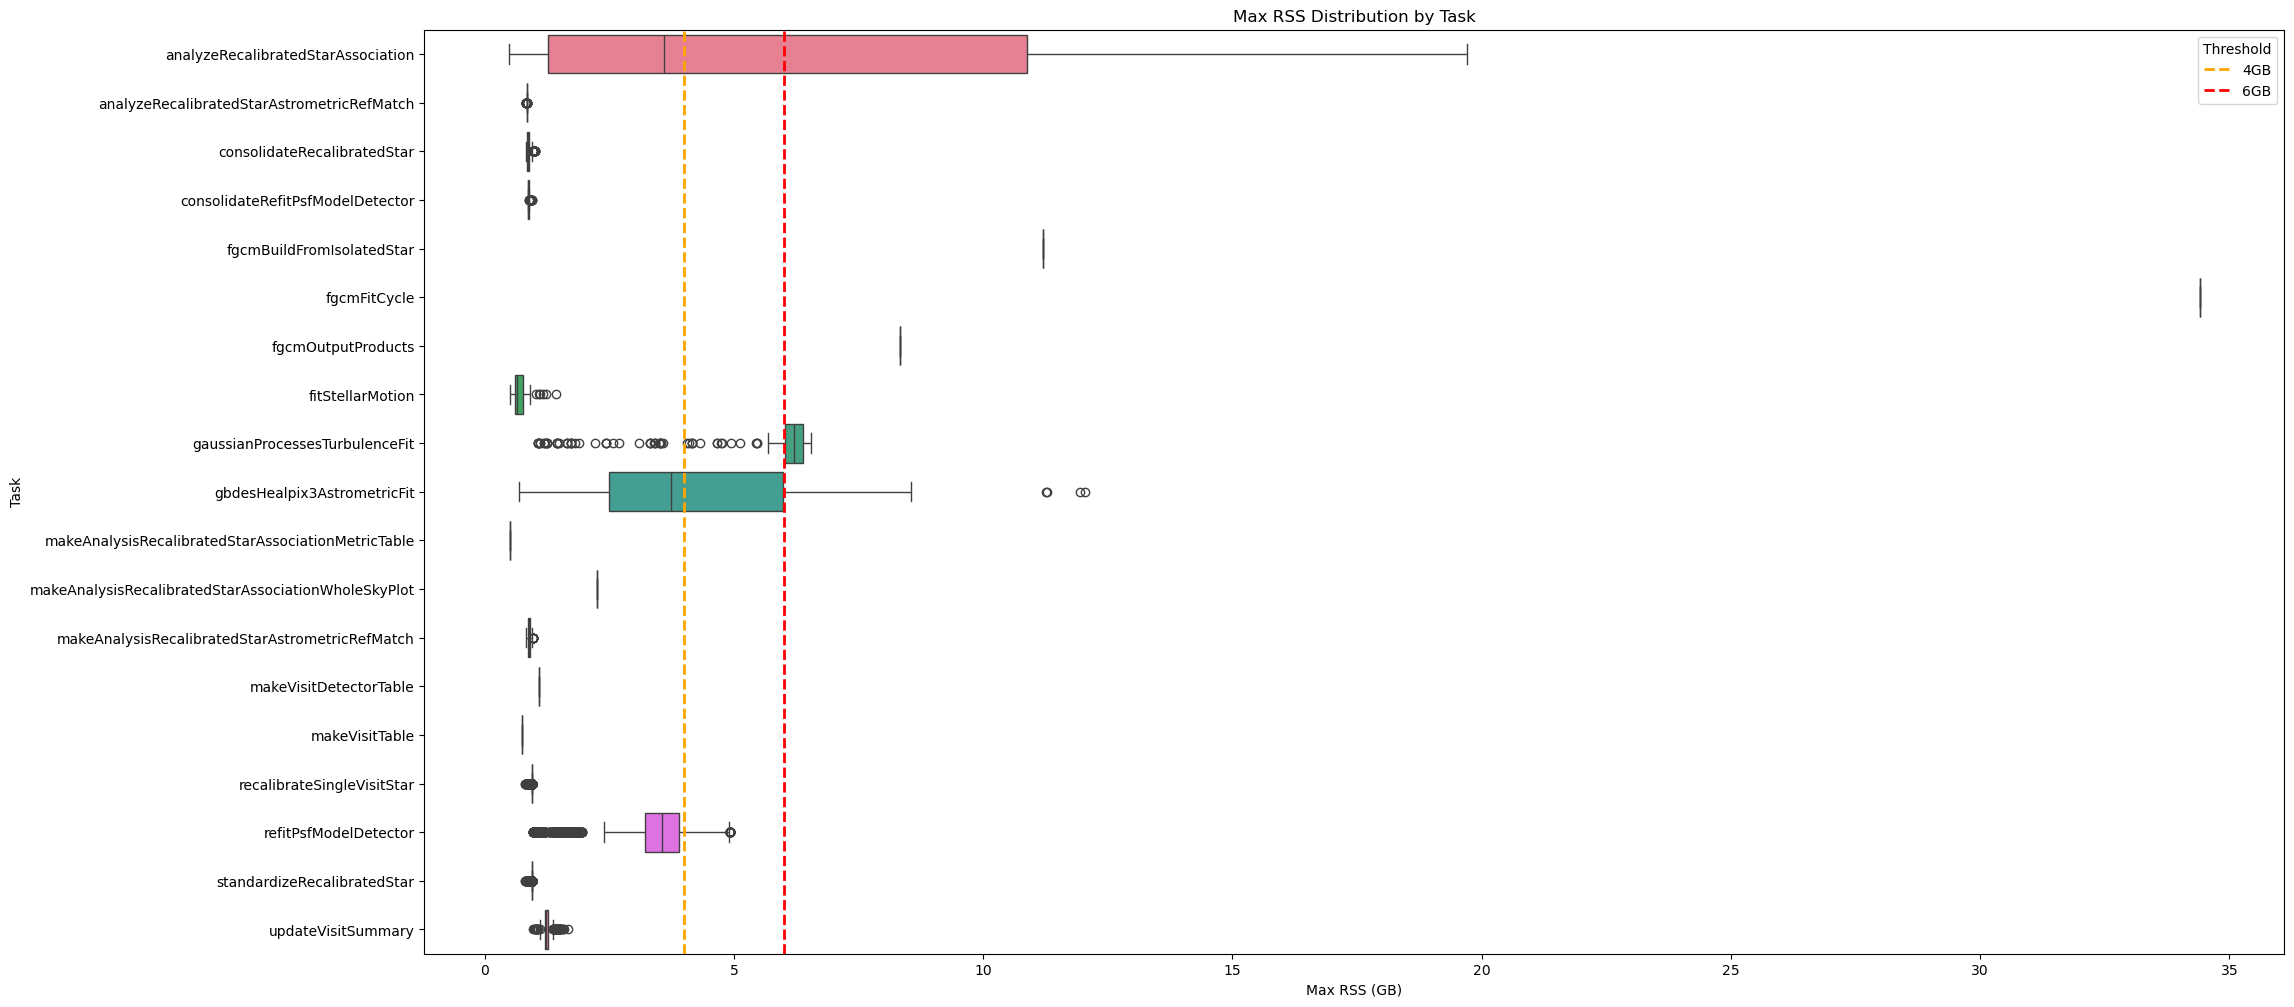
Fig. 8 Box plot showing maximum RSS for Stage 1 pipetasks in v30.0.4 release. Orange and red dashed lines indicate 4GB and 6GB memory thresholds. Almost all tasks require <6GB RSS.#
How we can see in the above chart, few tasks have outliers using more than 6GB of RSS. The following charts visualize all the quanta using more than 6GB of memory grouped by pipetasks. Most of these cases involve the analyzeRecalibratedStarAssociation and gaussianProcessesTurbulenceFit.
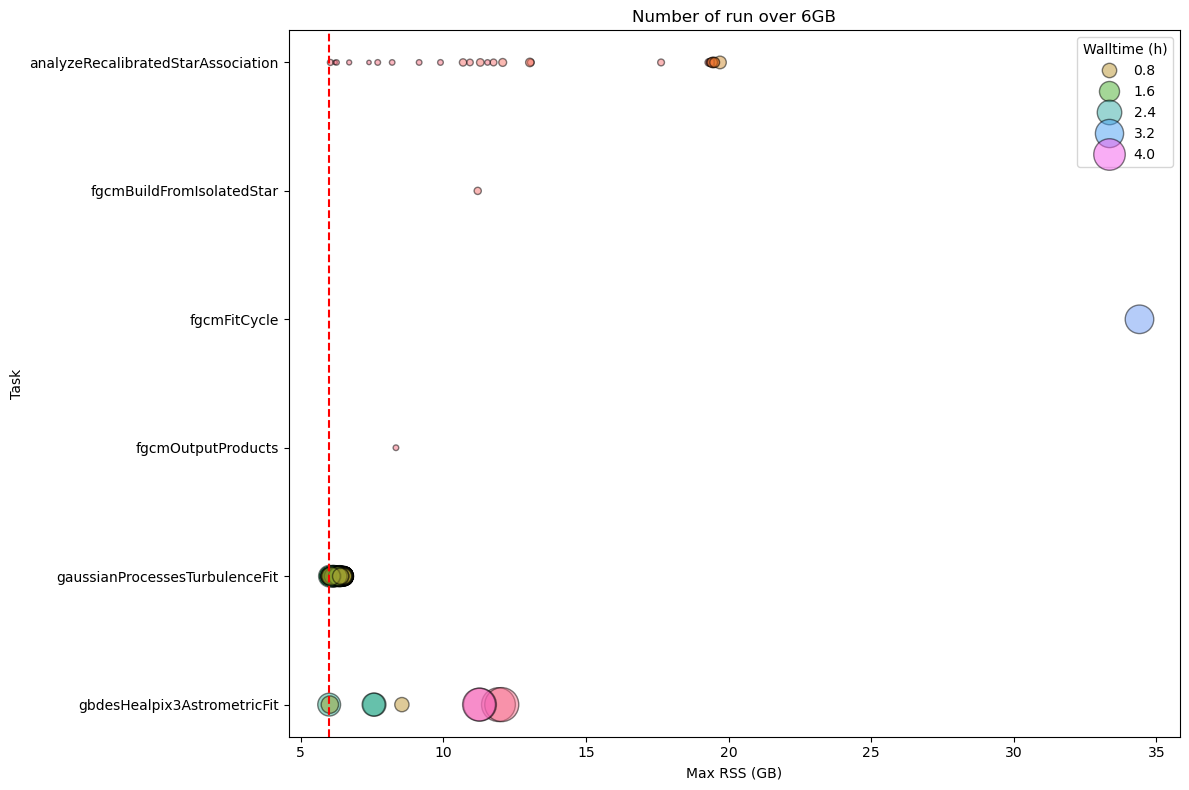
Fig. 9 Stage 2 Pipetask Runs Exceeding the 6 GB Memory Threshold – Frequency and Wall‑time Impact The plot displays the number of runs (quanta) per Stage 2 pipetask that exceed the 6 GB memory threshold (dashed red line). Each circle marks the frequency (i.e., the number of quanta) at which a given task reaches a specific memory level. The size of the circle is proportional to the walltime of the quanta, showing that the impact on the cores mobilised to handle the memory excess is more important than for Stage 1.#
To summarize the RSS usage, the main statistics for Stage 2 are listed in the following table.
max_rss_mean |
max_rss_median |
max_rss_min |
max_rss_max |
max_rss_95th_percentile |
|
|---|---|---|---|---|---|
analyzeRecalibratedStarAssociation |
6.52842 |
3.60212 |
0.486923 |
19.7006 |
19.4489 |
analyzeRecalibratedStarAstrometricRefMatch |
0.842907 |
0.842958 |
0.835007 |
0.846905 |
0.845247 |
consolidateRecalibratedStar |
0.874706 |
0.864555 |
0.837677 |
1.01746 |
0.950039 |
consolidateRefitPsfModelDetector |
0.880231 |
0.873501 |
0.864693 |
0.955421 |
0.914266 |
fgcmBuildFromIsolatedStar |
11.2081 |
11.2081 |
11.2081 |
11.2081 |
11.2081 |
fgcmFitCycle |
34.4069 |
34.4069 |
34.4069 |
34.4069 |
34.4069 |
fgcmOutputProducts |
8.3409 |
8.3409 |
8.3409 |
8.3409 |
8.3409 |
fitStellarMotion |
0.713758 |
0.656345 |
0.502529 |
1.43505 |
1.09982 |
gaussianProcessesTurbulenceFit |
6.12501 |
6.2077 |
1.07148 |
6.54644 |
6.51897 |
gbdesHealpix3AstrometricFit |
4.73779 |
3.74013 |
0.684643 |
12.0505 |
11.3513 |
makeAnalysisRecalibratedStarAssociationMetricTable |
0.505554 |
0.505554 |
0.505554 |
0.505554 |
0.505554 |
makeAnalysisRecalibratedStarAssociationWholeSkyPlot |
2.2629 |
2.2629 |
2.2629 |
2.2629 |
2.2629 |
makeAnalysisRecalibratedStarAstrometricRefMatch |
0.885111 |
0.883438 |
0.835526 |
0.977863 |
0.937105 |
makeVisitDetectorTable |
1.0936 |
1.0936 |
1.0936 |
1.0936 |
1.0936 |
makeVisitTable |
0.746078 |
0.746078 |
0.746078 |
0.746078 |
0.746078 |
recalibrateSingleVisitStar |
0.941043 |
0.942085 |
0.815155 |
0.946217 |
0.944084 |
refitPsfModelDetector |
3.41789 |
3.56515 |
0.96085 |
4.92125 |
4.36204 |
standardizeRecalibratedStar |
0.941053 |
0.942085 |
0.815155 |
0.946217 |
0.944084 |
updateVisitSummary |
1.24466 |
1.2331 |
0.976486 |
1.66946 |
1.39579 |
The next two charts depict the RSS distribution, binned in 1 GB intervals, for every quanta processed during Stage 2. In total, 567 886 quanta were examined, of which only 1916 (≈ 0.3 %) exceeding the 6 GB memory threshold.
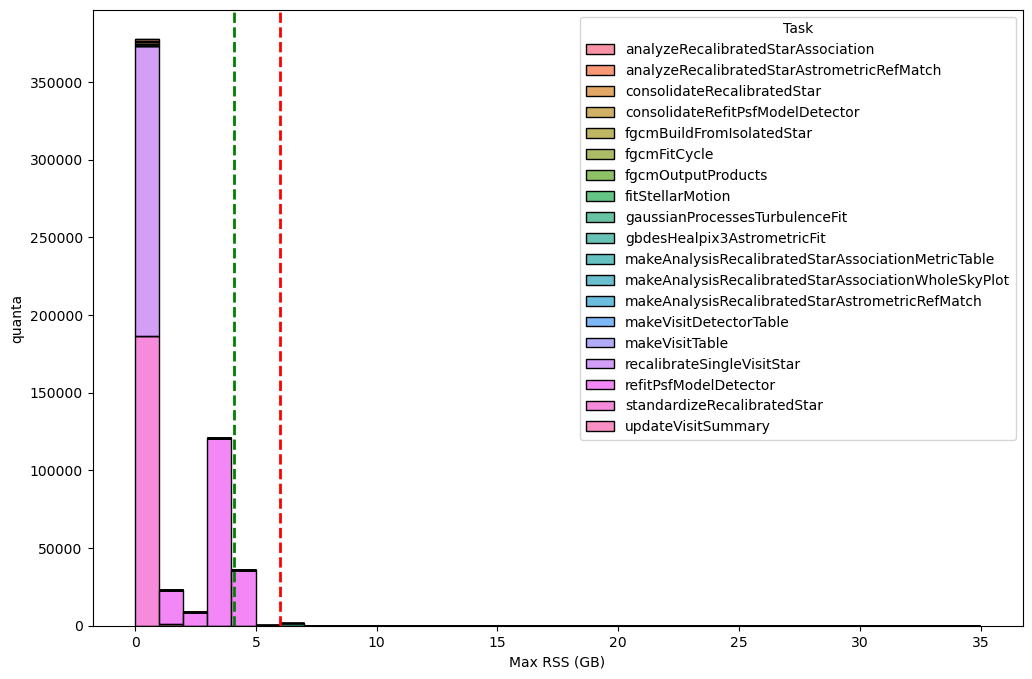
Fig. 10 Distribution of the maximum RSS per pipetask for the DM‑54249 (v30.0.4) Stage 2 run. Histogram bars are grouped in 1‑GB bins. The green dashed line marks the 95th‑percentile of the RSS values (95 % of pipetasks lie at or below this level), while dashed orange and red lines indicate the 4 GB and 6 GB memory thresholds, respectively; tasks above the 6GB threshold may need further optimisation or additional resources. Overall, 567 886 quanta were examined, of which 1916 (≈ 0.3 %) exceed the 6 GB limit.#
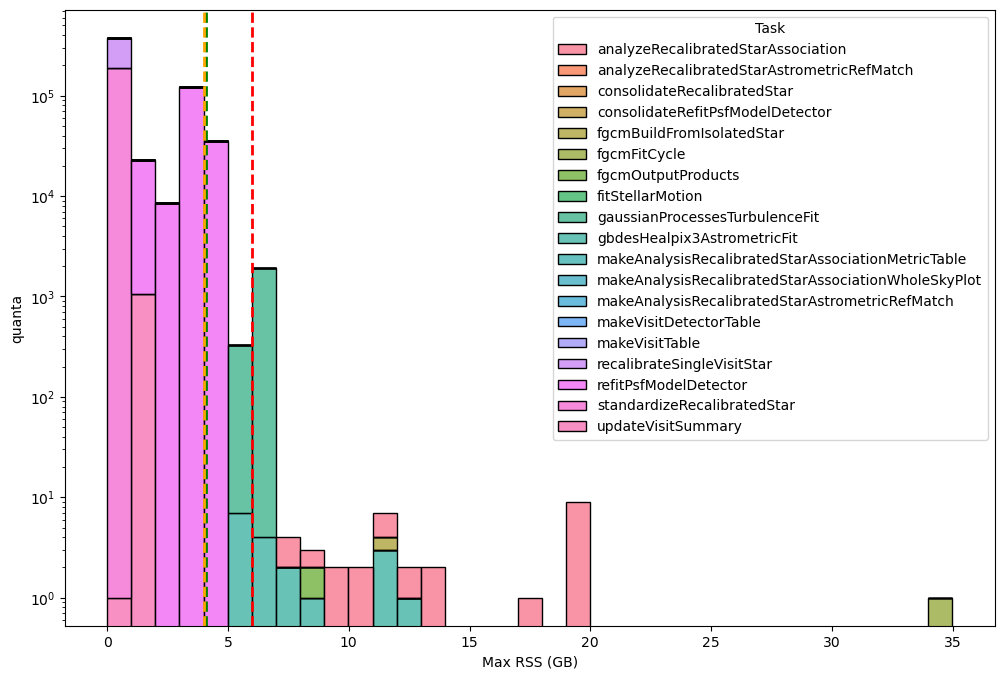
Fig. 11 Distribution of the maximum RSS per pipetask for the DM‑54249 (v30.0.4) Stage 2 run (logaritmic scale). Histogram bars are grouped in 1‑GB bins. The green dashed line marks the 95th‑percentile of the RSS values (95 % of pipetasks lie at or below this level), while dashed orange and red lines indicate the 4 GB and 6 GB memory thresholds, respectively; tasks above the 6GB threshold may need further optimisation or additional resources. Overall, 567 886 quanta were examined, of which 1916 (≈ 0.3 %) exceed the 6 GB limit.#
The next two charts, showing integrated wall time per RSS range, further confirms that 6 GB per core is generally sufficient for almost all Stage 2 pipeline tasks but the gaussianProcessesTurbulenceFit pipetask consistently utilizes around 6 GB of memory for extended periods. Globally, the pipetasks that use more than 6 GB account for 25% of the total wall‑time (2 077 h out of a total of 8 267 h).
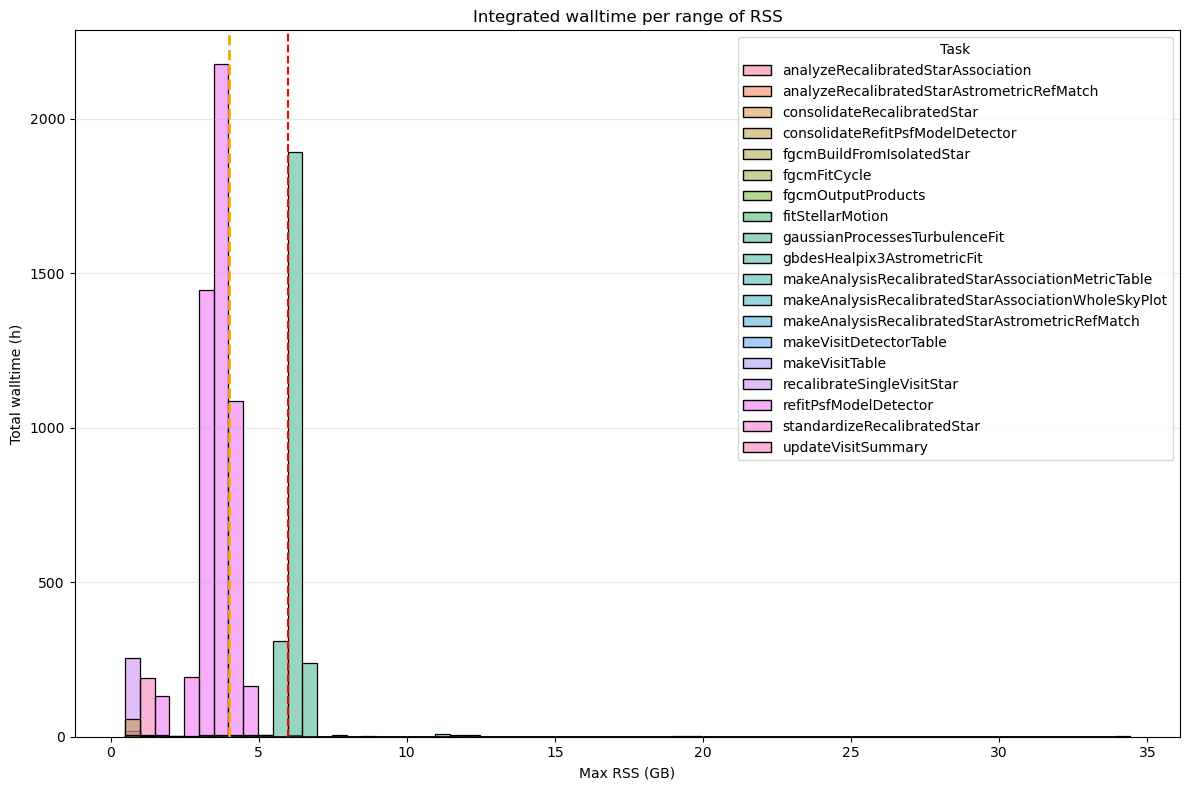
Fig. 12 Integrated wall-time per RSS range for for the DM‑54249 (v30.0.4) Stage 2. Dashed orange and red lines indicate the 4 GB and 6 GB memory thresholds, respectively. Tasks that exceed 6 GB of RSS account for a total of 2 077 hours (25%) of wall-time compared to the 8 267 hours of total wall-time.#
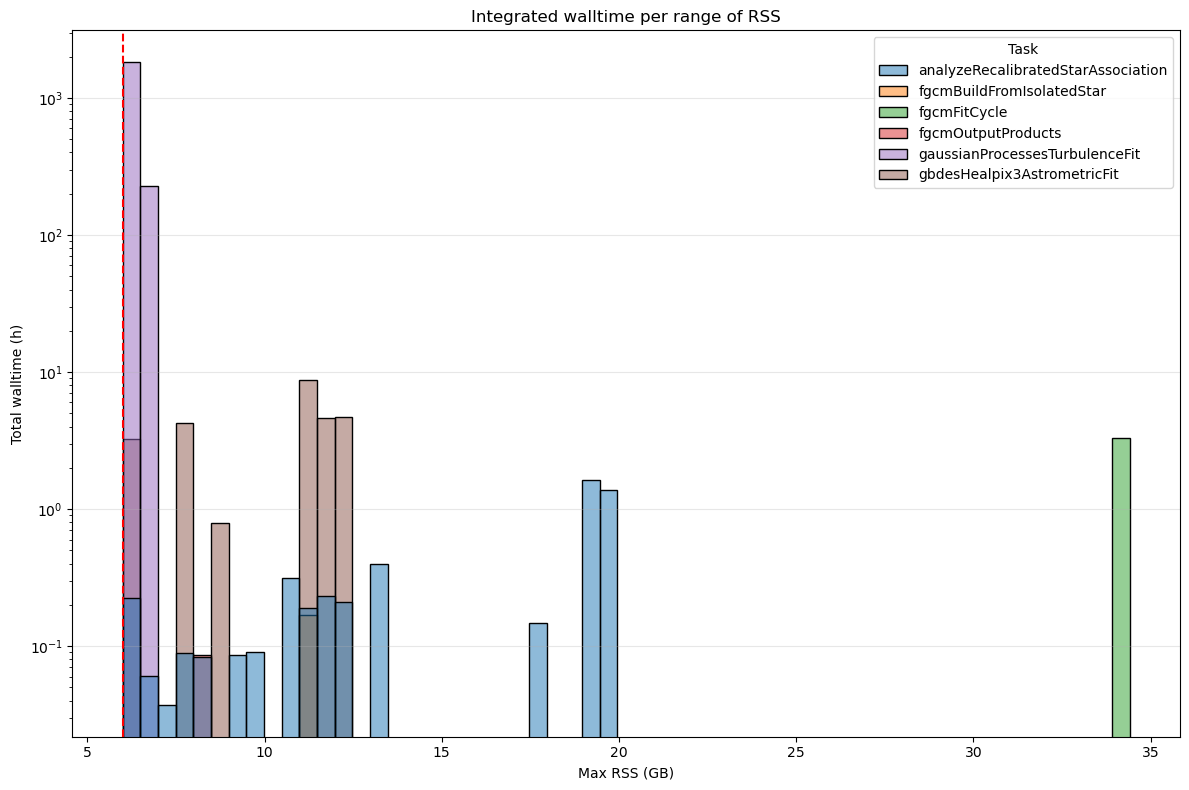
Fig. 13 Integrated wall-time per RSS range for for the DM‑54249 (v30.0.4) Stage 2 processes depassing 6GB. Y-axis in logarithmic scale. Dashed orange and red lines indicate the 4 GB and 6 GB memory thresholds, respectively. Tasks that exceed 6 GB of RSS account for a total of 2 077 hours (25%) of wall-time compared to the 8 267 hours of total wall-time.#
Stage3#
For Stage 3 we can also confirm that a 6 GB‑per‑core allocation is sufficient for virtually all pipetasks, with only a small set of outliers exceeding this limit. As the analysis below shows, the additional cores required to handle these memory “excesses” have a negligible impact on the overall resource consumption.
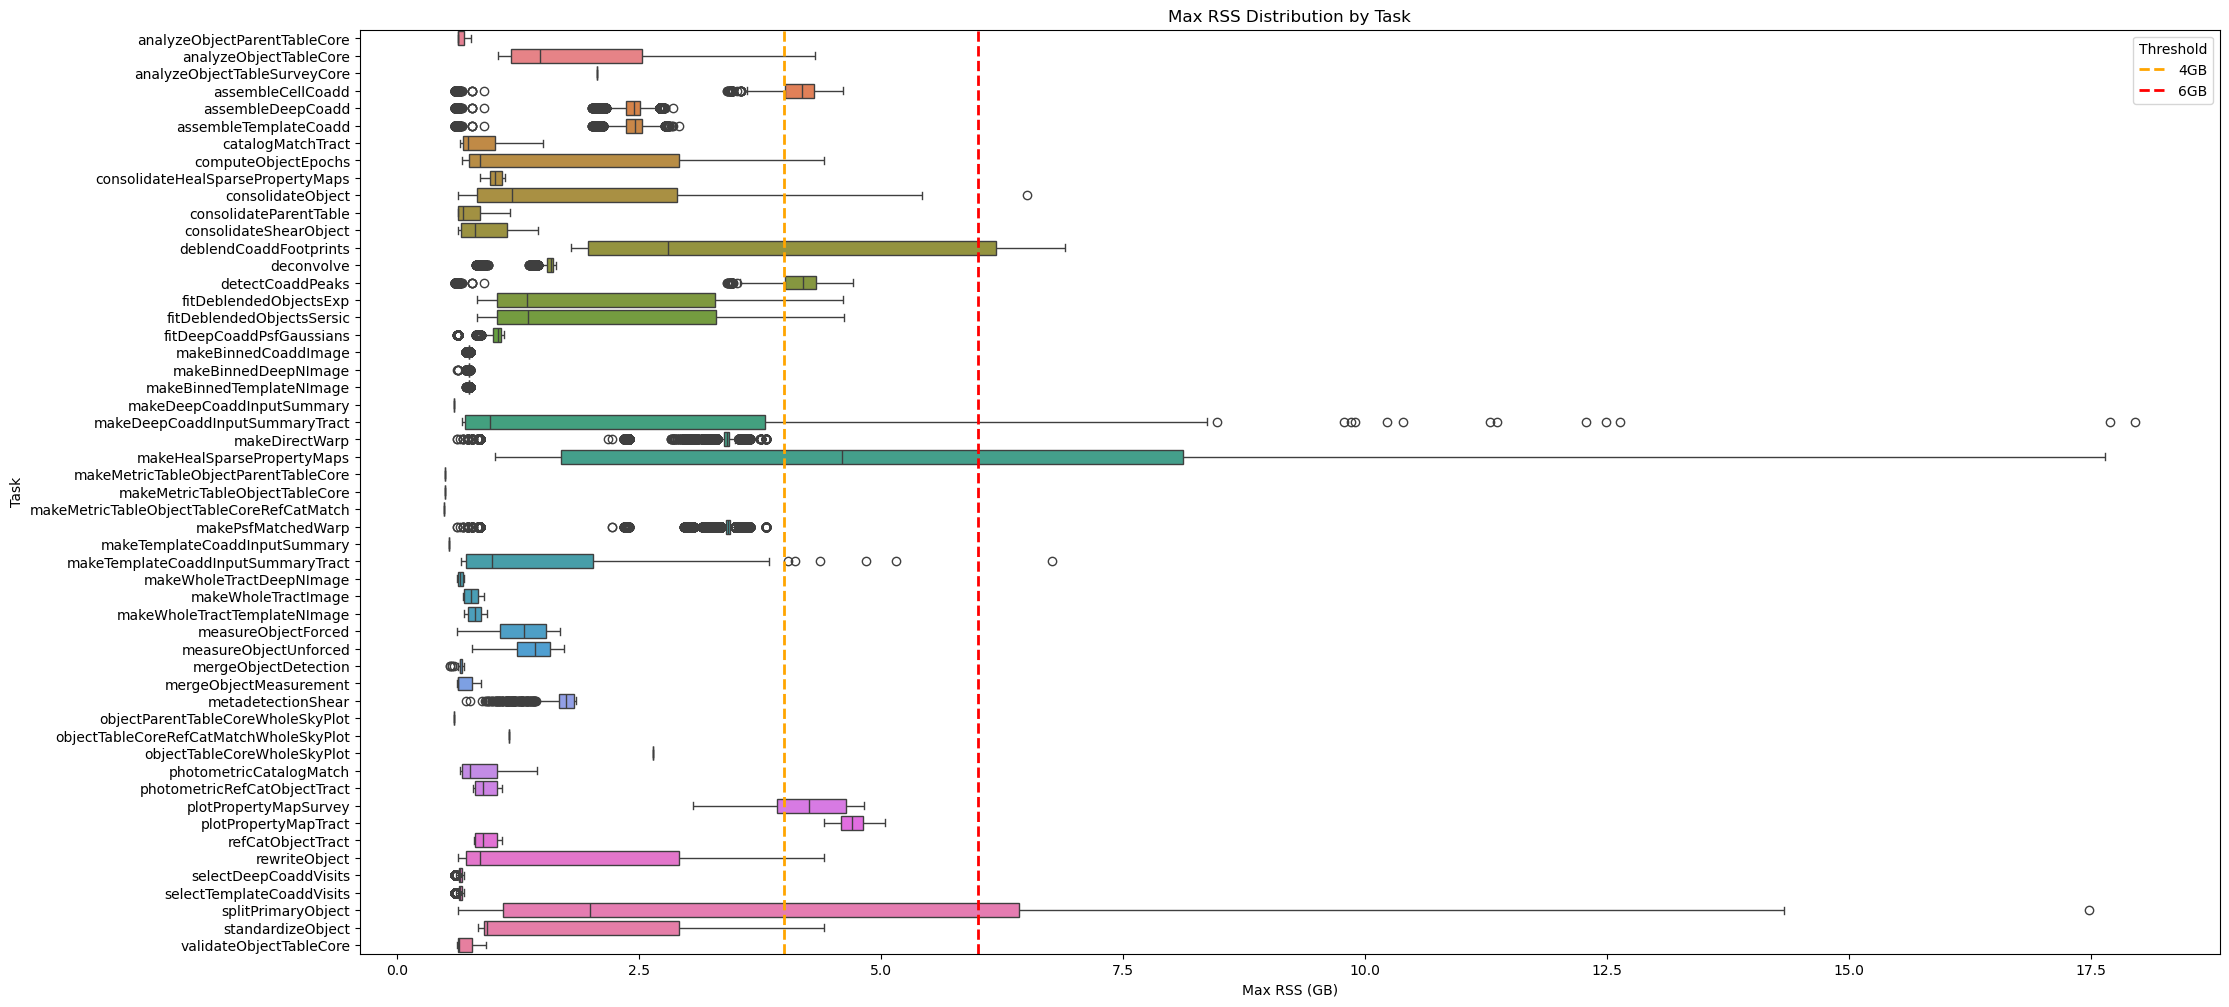
Fig. 14 Box plot showing maximum RSS for Stage 3 pipetasks in v30.0.4 release. Orange and red dashed lines indicate 4GB and 6GB memory thresholds. Almost all tasks require <6GB RSS.#
As shown in the chart above, several tasks have outliers exceeding the 6 GB of RSS threshold. The next figures display all quanta that use more than 6 GB of memory, grouped by pipetask. The pipetasks deblendCoaddFootprint and makeHealSparsePropertyMaps are the ones that exceed the 6 GB threshold most frequently. While the wall‑time for deblendCoaddFootprint is negligible, makeHealSparsePropertyMaps requires a not negligeable amount of wall-time.
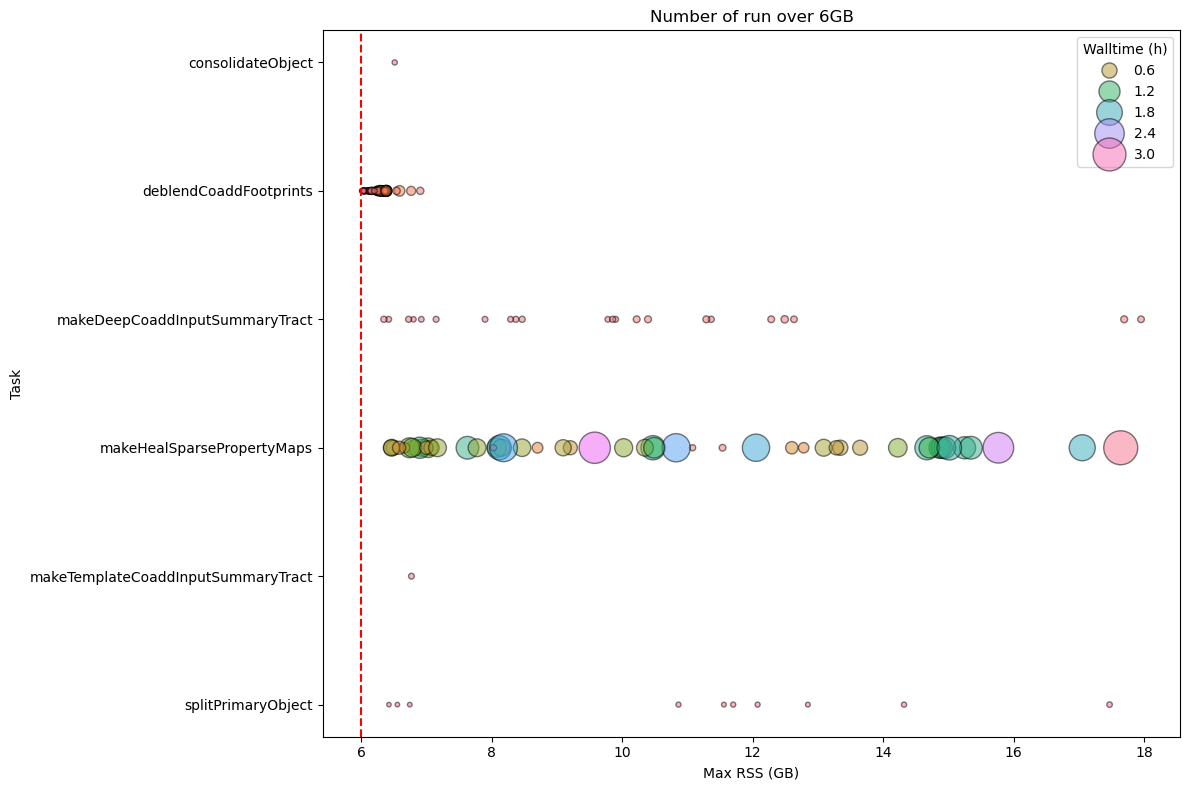
Fig. 15 Stage 3 Pipetask Runs Exceeding the 6 GB Memory Threshold – Frequency and Wall‑time Impact
The plot displays the number of runs (quanta) per Stage 3 pipetask that exceed the 6 GB memory threshold (dashed red line). Each circle marks the frequency (i.e., the number of quanta) at which a given task reaches a specific memory level. The size of the circle is proportional to the wall-time of the quanta, showing that the impact on the cores mobilised to handle the memory excess is more important than for Stage 1 in particular for deblendCoaddFootprint and makeHealSparsePropertyMaps pipetasks.#
To summarize the RSS usage, the main statistics for Stage 3 are listed in the following table.
max_rss_mean |
max_rss_median |
max_rss_min |
max_rss_max |
max_rss_95th_percentile |
|
|---|---|---|---|---|---|
analyzeObjectParentTableCore |
0.661792 |
0.62991 |
0.623722 |
0.764782 |
0.759708 |
analyzeObjectTableCore |
2.0096 |
1.48076 |
1.04328 |
4.32022 |
3.62084 |
analyzeObjectTableSurveyCore |
2.06782 |
2.06782 |
2.06782 |
2.06782 |
2.06782 |
assembleCellCoadd |
4.03475 |
4.18464 |
0.598366 |
4.60523 |
4.48033 |
assembleDeepCoadd |
2.36339 |
2.44578 |
0.598366 |
2.84563 |
2.72003 |
assembleTemplateCoadd |
2.37399 |
2.45605 |
0.598366 |
2.90918 |
2.73577 |
catalogMatchTract |
0.870329 |
0.729294 |
0.649548 |
1.50202 |
1.33685 |
computeObjectEpochs |
1.76113 |
0.852695 |
0.674358 |
4.414 |
4.12537 |
consolidateHealSparsePropertyMaps |
1.00861 |
1.01416 |
0.85503 |
1.11505 |
1.11164 |
consolidateObject |
2.04476 |
1.18666 |
0.63308 |
6.5104 |
5.16442 |
consolidateParentTable |
0.768712 |
0.679214 |
0.625923 |
1.1706 |
1.08776 |
consolidateShearObject |
0.899483 |
0.801559 |
0.624893 |
1.45676 |
1.26816 |
deblendCoaddFootprints |
3.7279 |
2.79314 |
1.79509 |
6.90266 |
6.37775 |
deconvolve |
1.53463 |
1.59141 |
0.817303 |
1.63986 |
1.62381 |
detectCoaddPeaks |
4.04251 |
4.19313 |
0.598366 |
4.70403 |
4.49203 |
fitDeblendedObjectsExp |
2.12206 |
1.3449 |
0.821854 |
4.60065 |
4.3463 |
fitDeblendedObjectsSersic |
2.12916 |
1.34765 |
0.822514 |
4.61545 |
4.37458 |
fitDeepCoaddPsfGaussians |
1.0076 |
1.04602 |
0.621536 |
1.09909 |
1.08942 |
makeBinnedCoaddImage |
0.740526 |
0.740738 |
0.706959 |
0.755222 |
0.751319 |
makeBinnedDeepNImage |
0.743317 |
0.744091 |
0.621178 |
0.755222 |
0.752476 |
makeBinnedTemplateNImage |
0.743883 |
0.744183 |
0.709461 |
0.755222 |
0.752476 |
makeDeepCoaddInputSummary |
0.592121 |
0.592121 |
0.592121 |
0.592121 |
0.592121 |
makeDeepCoaddInputSummaryTract |
2.95651 |
0.954704 |
0.665157 |
17.955 |
10.5732 |
makeDirectWarp |
3.34297 |
3.40371 |
0.617081 |
3.8084 |
3.44984 |
makeHealSparsePropertyMaps |
5.72563 |
4.59602 |
1.01052 |
17.6435 |
14.9179 |
makeMetricTableObjectParentTableCore |
0.490383 |
0.490383 |
0.490383 |
0.490383 |
0.490383 |
makeMetricTableObjectTableCore |
0.494553 |
0.494553 |
0.494553 |
0.494553 |
0.494553 |
makeMetricTableObjectTableCoreRefCatMatch |
0.488861 |
0.488861 |
0.488861 |
0.488861 |
0.488861 |
makePsfMatchedWarp |
3.39722 |
3.42105 |
0.617081 |
3.8084 |
3.57501 |
makeTemplateCoaddInputSummary |
0.533478 |
0.533478 |
0.533478 |
0.533478 |
0.533478 |
makeTemplateCoaddInputSummaryTract |
1.51558 |
0.98008 |
0.664383 |
6.76672 |
3.8465 |
makeWholeTractDeepNImage |
0.653418 |
0.6502 |
0.621967 |
0.688782 |
0.687188 |
makeWholeTractImage |
0.767424 |
0.759033 |
0.675655 |
0.895149 |
0.874706 |
makeWholeTractTemplateNImage |
0.804325 |
0.799746 |
0.695847 |
0.925613 |
0.922905 |
measureObjectForced |
1.2724 |
1.31315 |
0.620621 |
1.68477 |
1.59369 |
measureObjectUnforced |
1.39125 |
1.4261 |
0.775192 |
1.72871 |
1.64419 |
mergeObjectDetection |
0.658362 |
0.651159 |
0.541325 |
0.686981 |
0.682064 |
mergeObjectMeasurement |
0.6944 |
0.633909 |
0.620609 |
0.863731 |
0.845725 |
metadetectionShear |
1.67526 |
1.742 |
0.706963 |
1.84409 |
1.83381 |
objectParentTableCoreWholeSkyPlot |
0.586369 |
0.586369 |
0.586369 |
0.586369 |
0.586369 |
objectTableCoreRefCatMatchWholeSkyPlot |
1.15347 |
1.15347 |
1.15347 |
1.15347 |
1.15347 |
objectTableCoreWholeSkyPlot |
2.64798 |
2.64798 |
2.64798 |
2.64798 |
2.64798 |
photometricCatalogMatch |
0.864245 |
0.754807 |
0.647858 |
1.44056 |
1.28093 |
photometricRefCatObjectTract |
0.916859 |
0.882507 |
0.788025 |
1.08813 |
1.04813 |
plotPropertyMapSurvey |
4.1602 |
4.25547 |
3.05684 |
4.82431 |
4.79948 |
plotPropertyMapTract |
4.69683 |
4.70322 |
4.41187 |
5.04356 |
4.92766 |
refCatObjectTract |
0.921133 |
0.888134 |
0.798336 |
1.08419 |
1.07457 |
rewriteObject |
1.74653 |
0.852695 |
0.624527 |
4.414 |
4.12537 |
selectDeepCoaddVisits |
0.653076 |
0.651211 |
0.595356 |
0.688534 |
0.684441 |
selectTemplateCoaddVisits |
0.65371 |
0.652361 |
0.595356 |
0.688534 |
0.684475 |
splitPrimaryObject |
4.38222 |
1.9906 |
0.63155 |
17.4722 |
13.1409 |
standardizeObject |
1.83685 |
0.929029 |
0.836823 |
4.414 |
4.12537 |
validateObjectTableCore |
0.701319 |
0.640598 |
0.621323 |
0.916172 |
0.882812 |
The next two charts depict the RSS distribution, binned in 1 GB intervals, for every quanta processed during Stage 3 In total, 887 683 quanta were examined, of which only 637 (≈ 0.07 %) exceeding the 6 GB memory threshold.
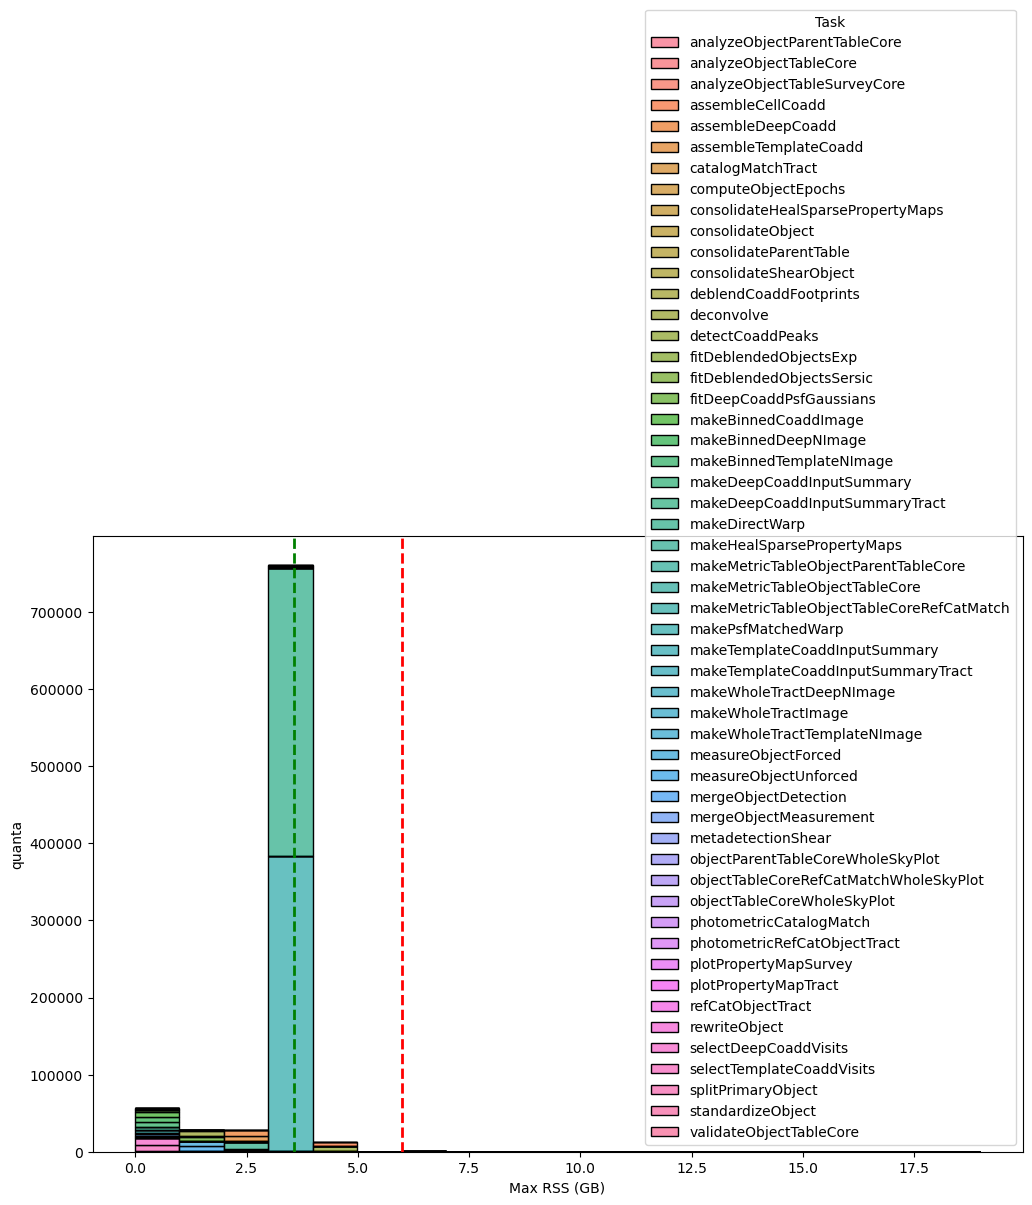
Fig. 16 Distribution of the maximum RSS per pipetask for the DM‑54249 (v30.0.4) Stage 3 run. Histogram bars are grouped in 1‑GB bins. The green dashed line marks the 95th‑percentile of the RSS values (95 % of pipetasks lie at or below this level), while dashed orange and red lines indicate the 4 GB and 6 GB memory thresholds, respectively; tasks above the 6GB threshold line may need further optimisation or additional resources. Overall, 887 683 quanta were examined, of which 637 (≈ 0.07 %) exceed the 6 GB limit.#
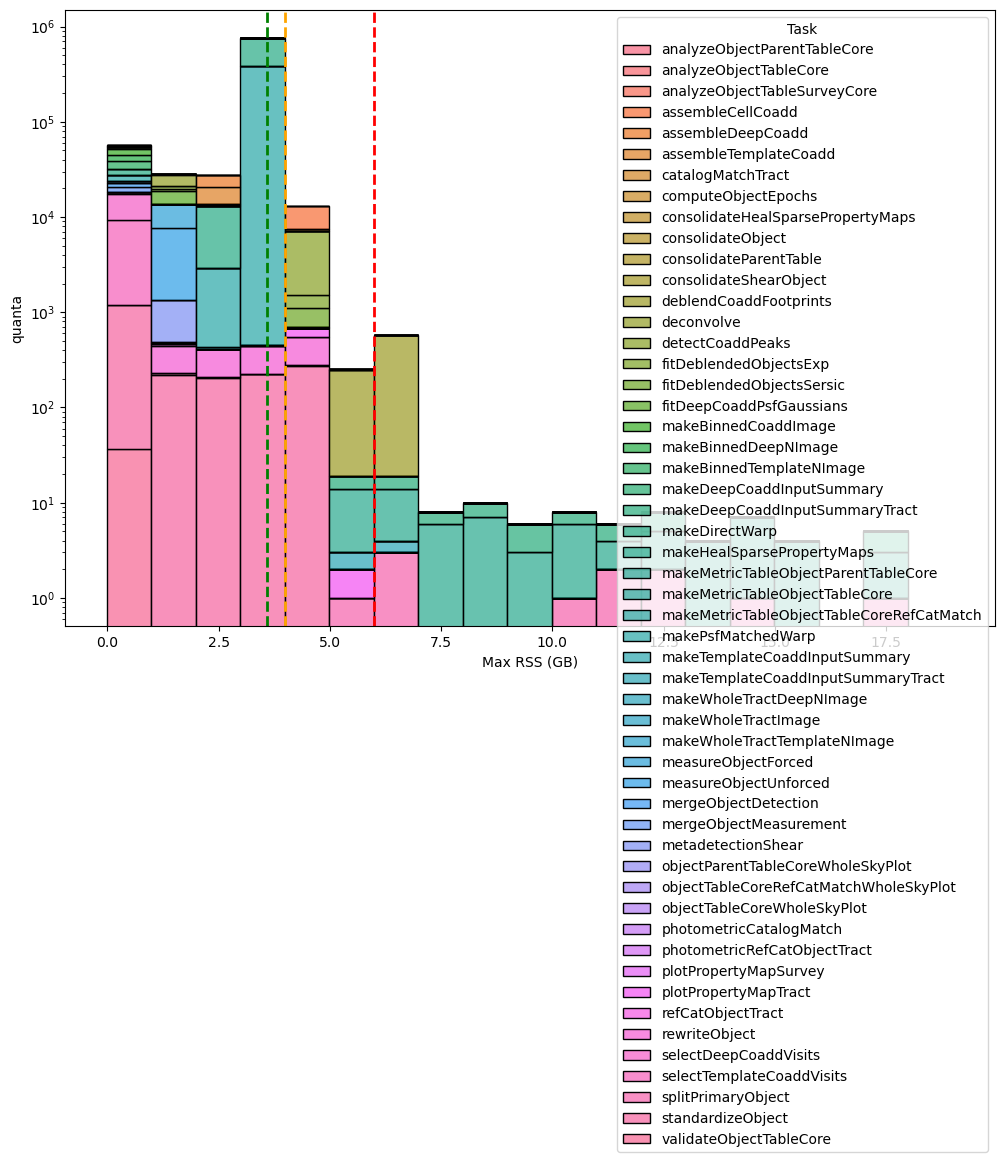
Fig. 17 Distribution of the maximum RSS per pipetask for the DM‑54249 (v30.0.4) Stage 3 run (logaritmic scale). Histogram bars are grouped in 1‑GB bins. The green dashed line marks the 95th‑percentile of the RSS values (95 % of pipetasks lie at or below this level), while dashed orange and red lines indicate the 4 GB and 6 GB memory thresholds, respectively; tasks above the 6GB threshold may need further optimisation or additional resources. Overall, 887 683 quanta were examined, of which 637 (≈ 0.07 %) exceed the 6 GB limit.#
The next two charts, showing integrated wall time per RSS range, further confirms that 6 GB per core is generally sufficient for almost all Stage 3 pipeline tasks but the gaussianProcessesTurbulenceFit pipetask consistently utilizes around 6 GB of memory for extended periods.
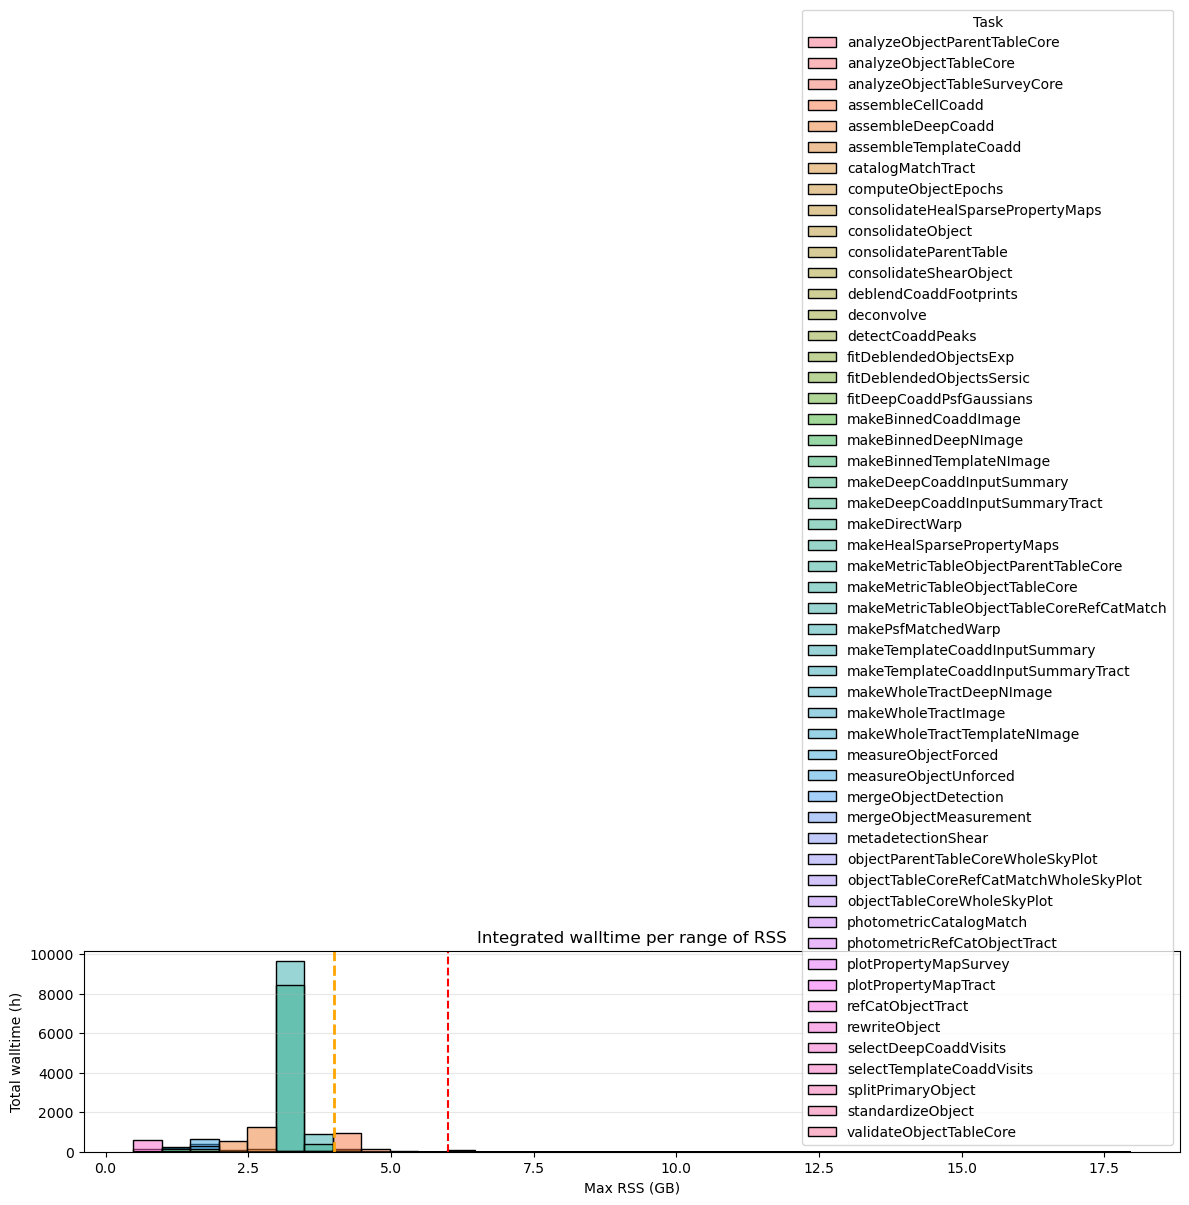
Fig. 18 Integrated wall-time per RSS range for for the DM‑54249 (v30.0.4) Stage 3. Dashed orange and red lines indicate the 4 GB and 6 GB memory thresholds, respectively. Tasks that exceed 6 GB of RSS account for a total of 124 h (0.5%) of wall-time compared to the 25 974 h of total wall-time.#
If we switch to 6GB/core workernodes, these quanta, as shown in the next plot, will mobilize some cores for ~124 hours compared (~0.5%) to ~25 974 hours total wall-time.
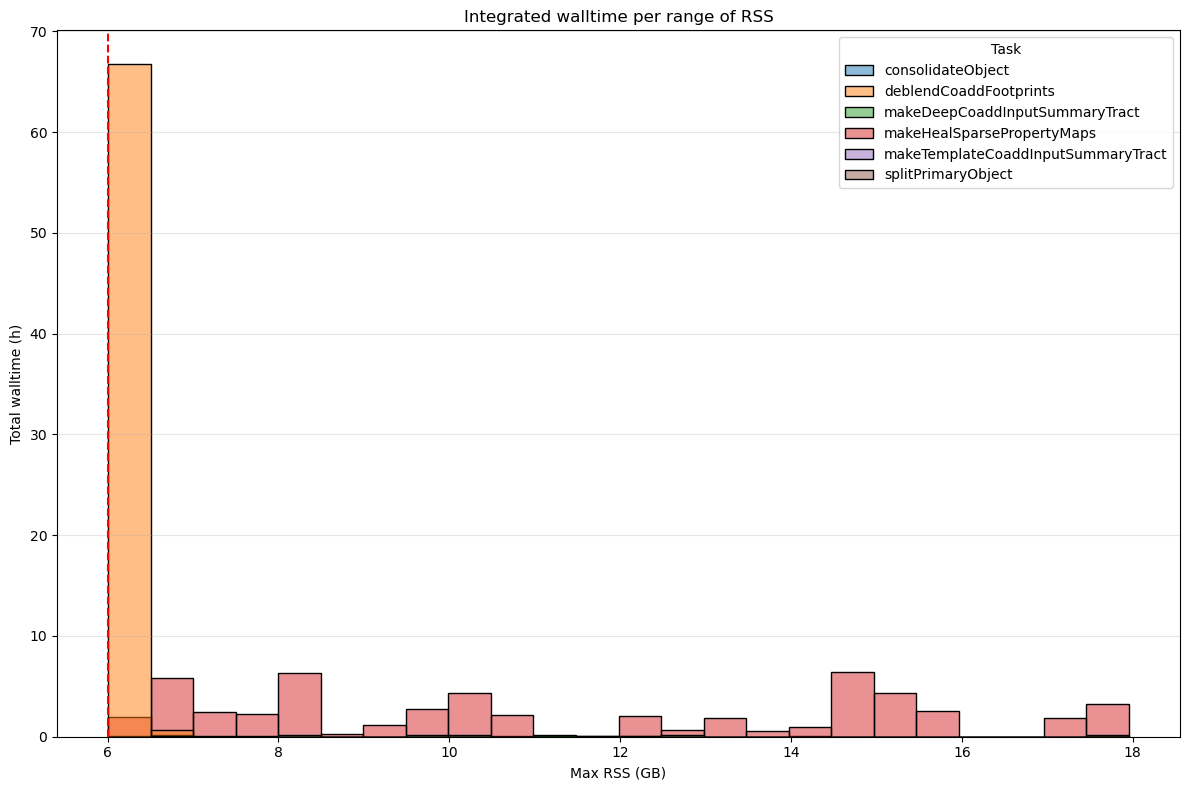
Fig. 19 Integrated wall-time per RSS range for for the DM‑54249 (v30.0.4) Stage 3 processes depassing 6GB. Dashed orange and red lines indicate the 4 GB and 6 GB memory thresholds, respectively. Tasks that exceed 6 GB of RSS account for a total of 124 h (0.5%) of wall-time compared to the 25 974 h of total wall-time.#
Stage 4#
As shown in the following chart, we have two pipeatsk (analyzeSourceAssociation and associateAnalysisSource) with outiliers exceeding systematically the 6GB threshold and one task (skyCorr) always over this threshold.
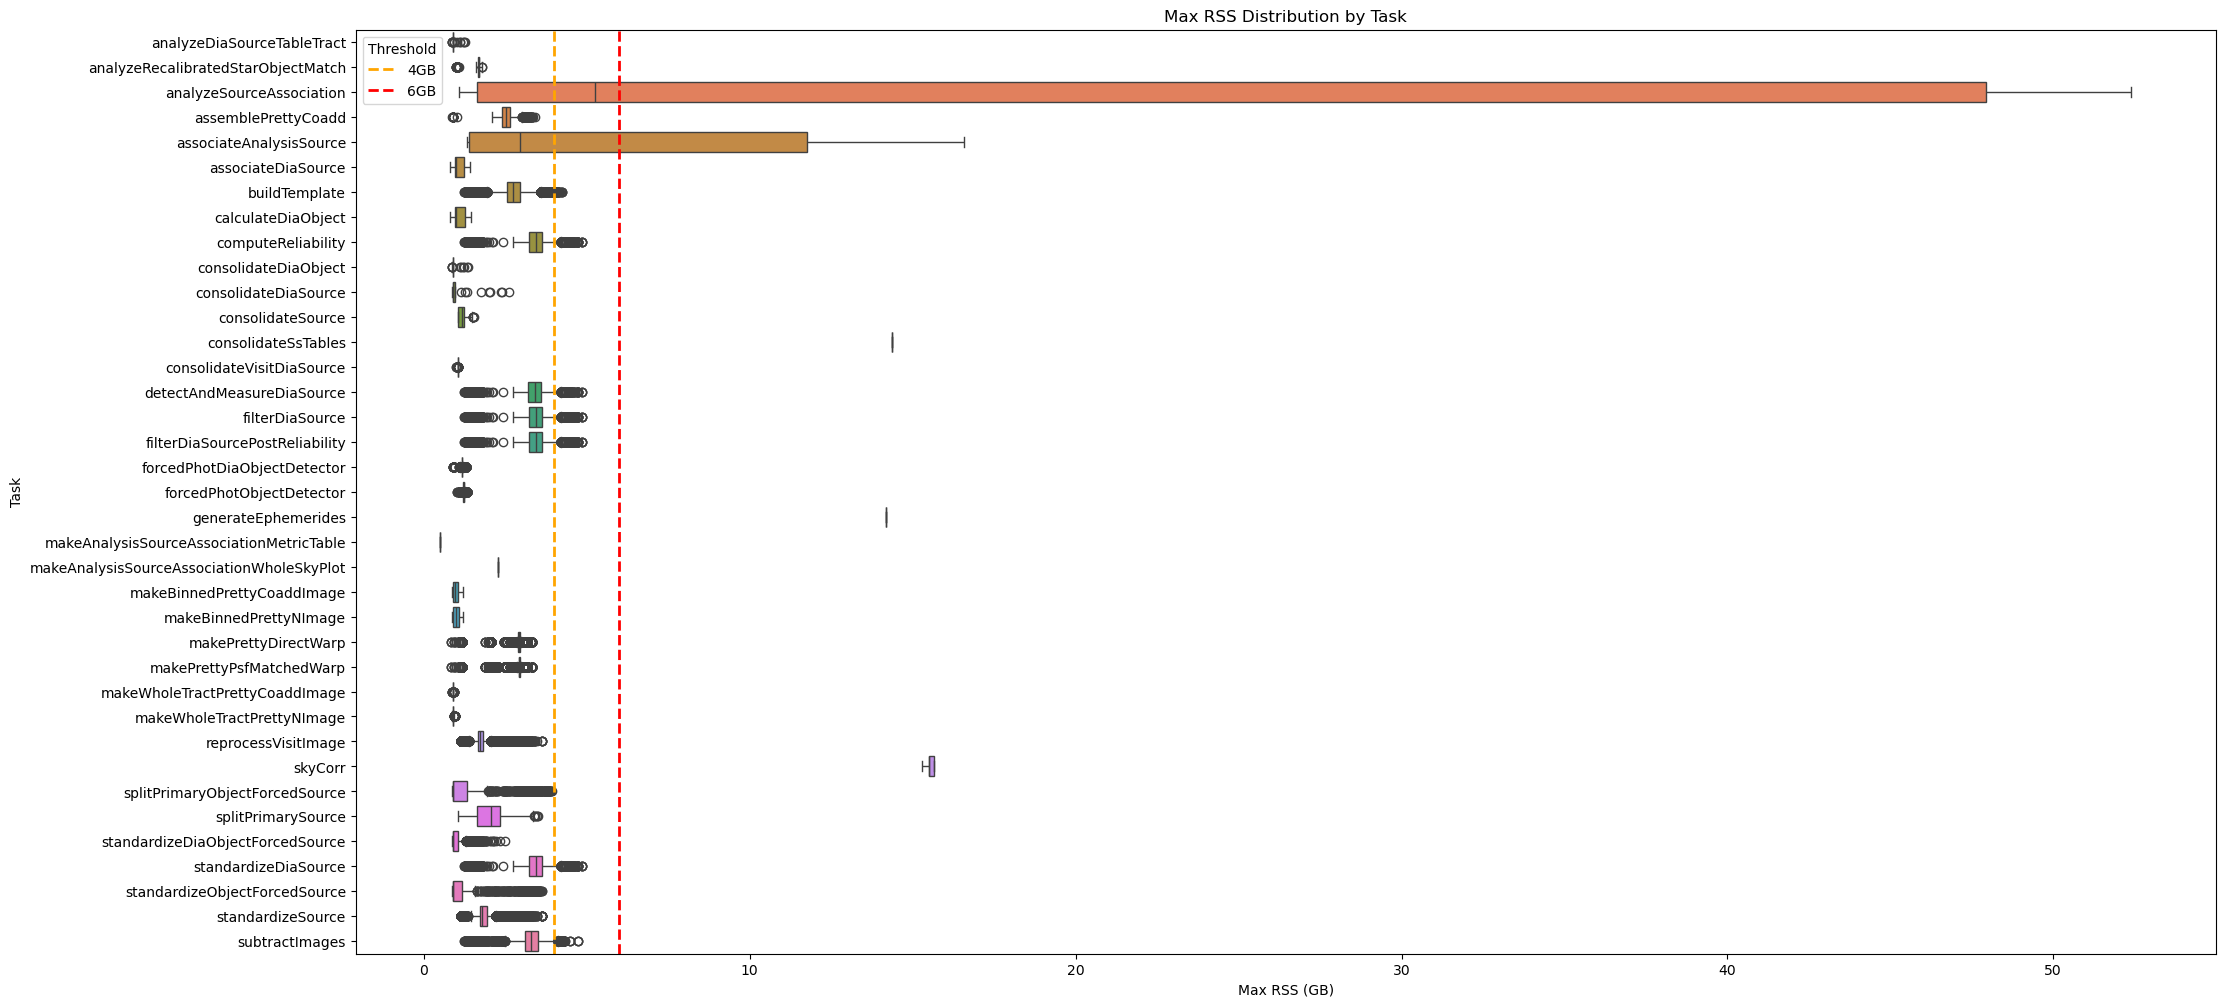
Fig. 20 Box plot showing maximum RSS for Stage 4 pipetasks in v30.0.4 release.
Orange and red dashed lines indicate 4GB and 6GB memory thresholds.
Most tasks require < 6 GB RSS, but many quanta of associateAnalysisSource, skyCorr, and analyzeSourceAssoclation exceed this threshold.#
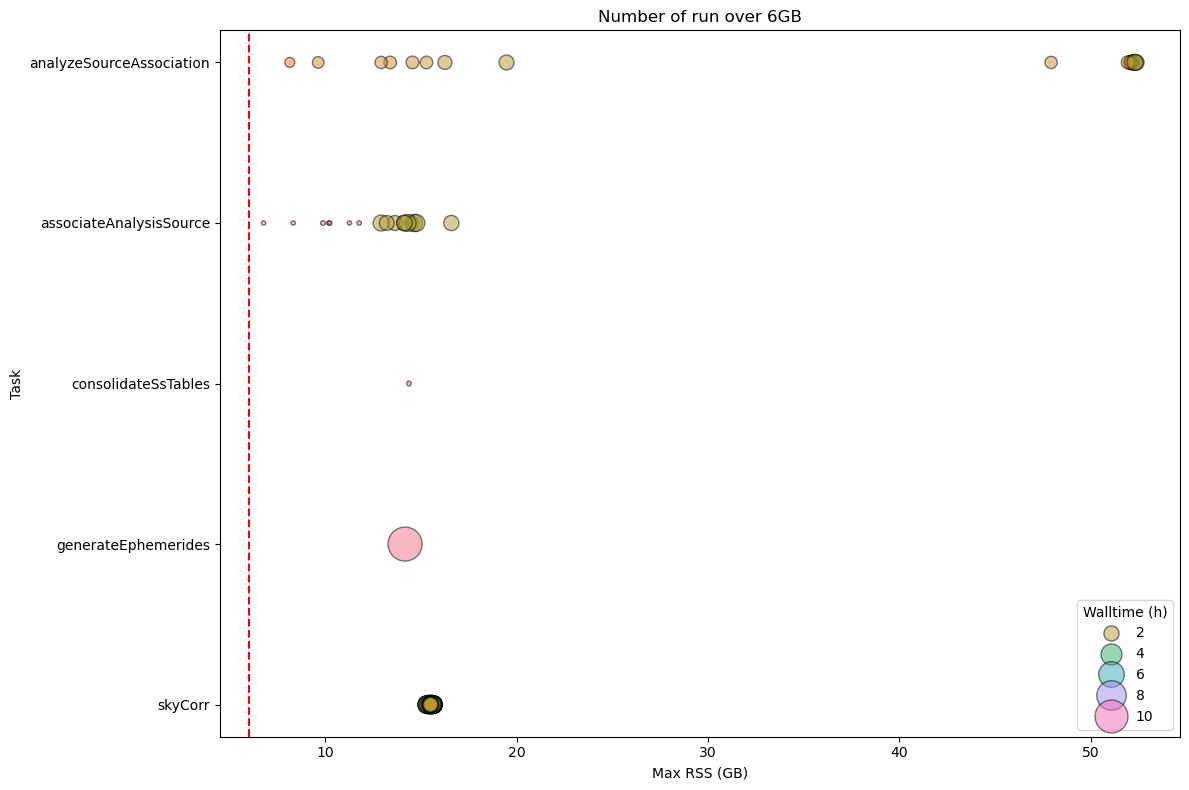
Fig. 21 Stage 4 Pipetask Runs Exceeding the 6 GB Memory Threshold – Frequency and Wall‑time Impact
The plot displays the number of runs (quanta) per Stage 4 pipetask that exceed the 6 GB memory threshold (dashed red line). Each circle marks the frequency (i.e., the number of quanta) at which a given task reaches a specific memory level. The size of the circle is proportional to the wall-time of the quanta, showing that the impact on the cores mobilised to handle the memory excess is important in particular for skyCorr and associateAnalysisSource pipetasks.#
Summary of RSS usage for each pipetask in Stage 4 is reported in the next table.
max_rss_mean |
max_rss_median |
max_rss_min |
max_rss_max |
max_rss_95th_percentile |
|
|---|---|---|---|---|---|
analyzeDiaSourceTableTract |
0.928535 |
0.882538 |
0.873363 |
1.26305 |
1.21465 |
analyzeRecalibratedStarObjectMatch |
1.55229 |
1.67764 |
0.998528 |
1.78778 |
1.73491 |
analyzeSourceAssociation |
17.9633 |
5.24598 |
1.0643 |
52.3885 |
52.3016 |
assemblePrettyCoadd |
2.51527 |
2.522 |
0.877766 |
3.40301 |
2.85664 |
associateAnalysisSource |
6.26791 |
2.9582 |
1.3198 |
16.5839 |
14.6256 |
associateDiaSource |
1.06694 |
0.988182 |
0.802597 |
1.41405 |
1.37101 |
buildTemplate |
2.74483 |
2.74868 |
1.23352 |
4.24453 |
3.29812 |
calculateDiaObject |
1.07226 |
0.989132 |
0.802597 |
1.43788 |
1.39145 |
computeReliability |
3.44646 |
3.44279 |
1.23352 |
4.84737 |
3.9151 |
consolidateDiaObject |
0.936493 |
0.881018 |
0.873474 |
1.36119 |
1.2451 |
consolidateDiaSource |
1.12855 |
0.882492 |
0.872929 |
2.60363 |
2.36882 |
consolidateSource |
1.17048 |
1.16326 |
1.03833 |
1.52712 |
1.37102 |
consolidateSsTables |
14.3674 |
14.3674 |
14.3674 |
14.3674 |
14.3674 |
consolidateVisitDiaSource |
1.03743 |
1.03797 |
0.997753 |
1.04251 |
1.04061 |
detectAndMeasureDiaSource |
3.4137 |
3.40743 |
1.23352 |
4.84737 |
3.90879 |
filterDiaSource |
3.44646 |
3.44279 |
1.23352 |
4.84737 |
3.9151 |
filterDiaSourcePostReliability |
3.44646 |
3.44279 |
1.23352 |
4.84737 |
3.9151 |
forcedPhotDiaObjectDetector |
1.17106 |
1.16402 |
0.880531 |
1.30658 |
1.22909 |
forcedPhotObjectDetector |
1.22727 |
1.22321 |
1.01908 |
1.32397 |
1.2835 |
generateEphemerides |
14.1652 |
14.1652 |
14.1652 |
14.1652 |
14.1652 |
makeAnalysisSourceAssociationMetricTable |
0.500427 |
0.500427 |
0.500427 |
0.500427 |
0.500427 |
makeAnalysisSourceAssociationWholeSkyPlot |
2.26077 |
2.26077 |
2.26077 |
2.26077 |
2.26077 |
makeBinnedPrettyCoaddImage |
0.984554 |
0.969227 |
0.877277 |
1.19003 |
1.17618 |
makeBinnedPrettyNImage |
1.00128 |
0.983116 |
0.877567 |
1.19003 |
1.18171 |
makePrettyDirectWarp |
2.87996 |
2.91811 |
0.83453 |
3.30758 |
2.96737 |
makePrettyPsfMatchedWarp |
2.92708 |
2.92727 |
0.83453 |
3.30758 |
3.10265 |
makeWholeTractPrettyCoaddImage |
0.887574 |
0.884747 |
0.876122 |
0.934532 |
0.907702 |
makeWholeTractPrettyNImage |
0.897239 |
0.885832 |
0.876122 |
0.967247 |
0.947681 |
reprocessVisitImage |
1.75545 |
1.73379 |
1.12519 |
3.61885 |
2.00745 |
skyCorr |
15.5443 |
15.4962 |
15.2956 |
15.6576 |
15.6496 |
splitPrimaryObjectForcedSource |
1.42861 |
0.885994 |
0.875179 |
3.93439 |
3.54477 |
splitPrimarySource |
2.04387 |
2.06326 |
1.05053 |
3.49865 |
3.01151 |
standardizeDiaObjectForcedSource |
1.00443 |
0.885902 |
0.874744 |
2.47455 |
1.5126 |
standardizeDiaSource |
3.44646 |
3.44279 |
1.23352 |
4.84737 |
3.9151 |
standardizeObjectForcedSource |
1.38892 |
0.885784 |
0.87326 |
3.62589 |
3.37692 |
standardizeSource |
1.82974 |
1.79422 |
1.12519 |
3.61885 |
2.10644 |
subtractImages |
3.31583 |
3.30142 |
1.23352 |
4.71892 |
3.81416 |
However, as demonstrated in the next two charts, the number of quanta (quanta) exceeding the thresholds is quite minimal compared to the total: in fact, we had 1143 (0.04%) quanta exceeding the threshold and 2 593 783 quanta processed in total.
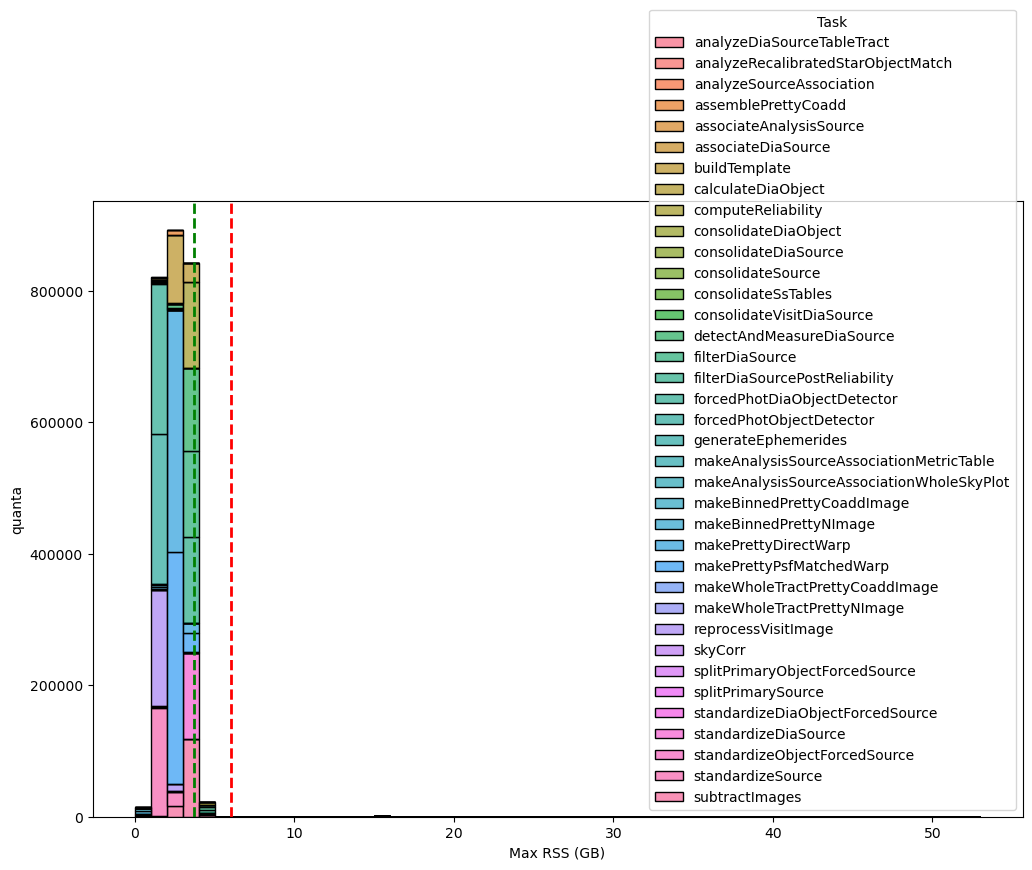
Fig. 22 Distribution of the maximum RSS per pipetask for the DM‑54249 (v30.0.4) Stage 4 run. Histogram bars are grouped in 1‑GB bins. The green dashed line marks the 95th‑percentile of the RSS values (95 % of pipetasks lie at or below this level), while dashed orange and red lines indicate the 4 GB and 6 GB memory thresholds, respectively; tasks above the 6GB threshold may need further optimisation or additional resources. Overall, 2 593 783 quanta were examined, of which 1143 (≈ 0.04 %) exceed the 6 GB limit.#
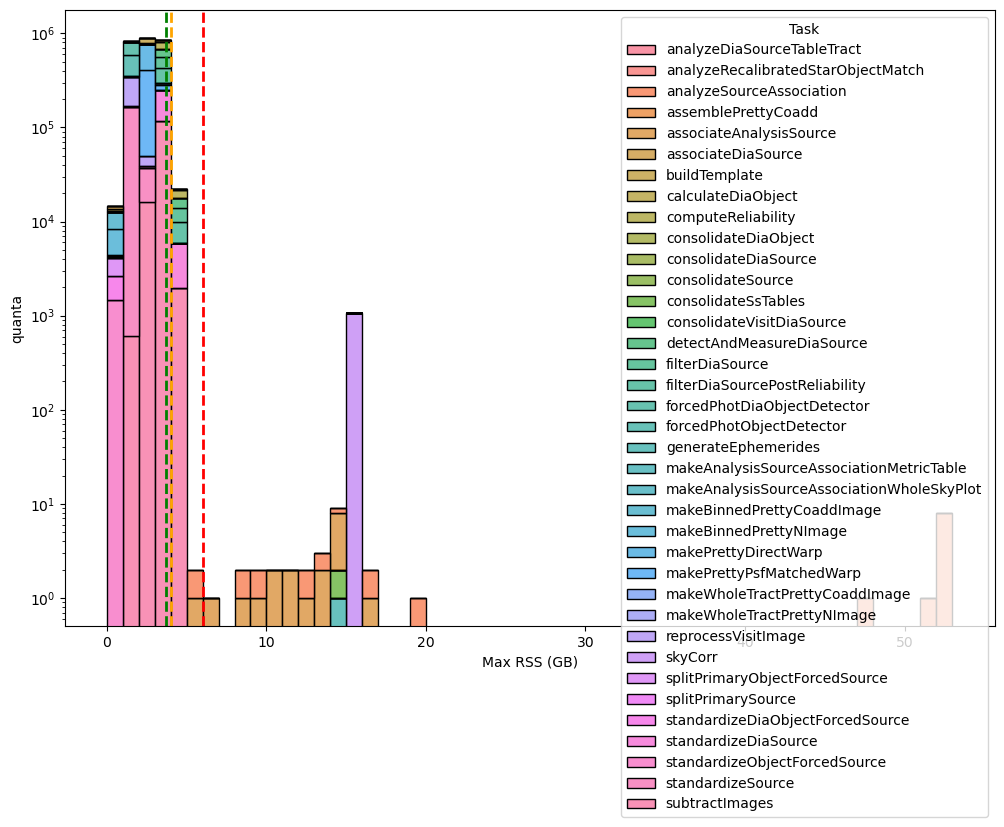
Fig. 23 Distribution of the maximum RSS per pipetask for the DM‑54249 (v30.0.4) Stage 4 run (logaritmic scale). Histogram bars are grouped in 1‑GB bins. The green dashed line marks the 95th‑percentile of the RSS values (95 % of pipetasks lie at or below this level), while dashed orange and red lines indicate the 4 GB and 6 GB memory thresholds, respectively; tasks above the 6GB threshold may need further optimisation or additional resources. Overall, 2 593 783 quanta were examined, of which 1143 (≈ 0.04 %) exceed the 6 GB limit.#
If we switch to 6GB/core workernodes, these quanta, as shown in the next plot, will mobilize a few cores for 2 184 h (~4%) compared to 52 124 h of total wall-time.
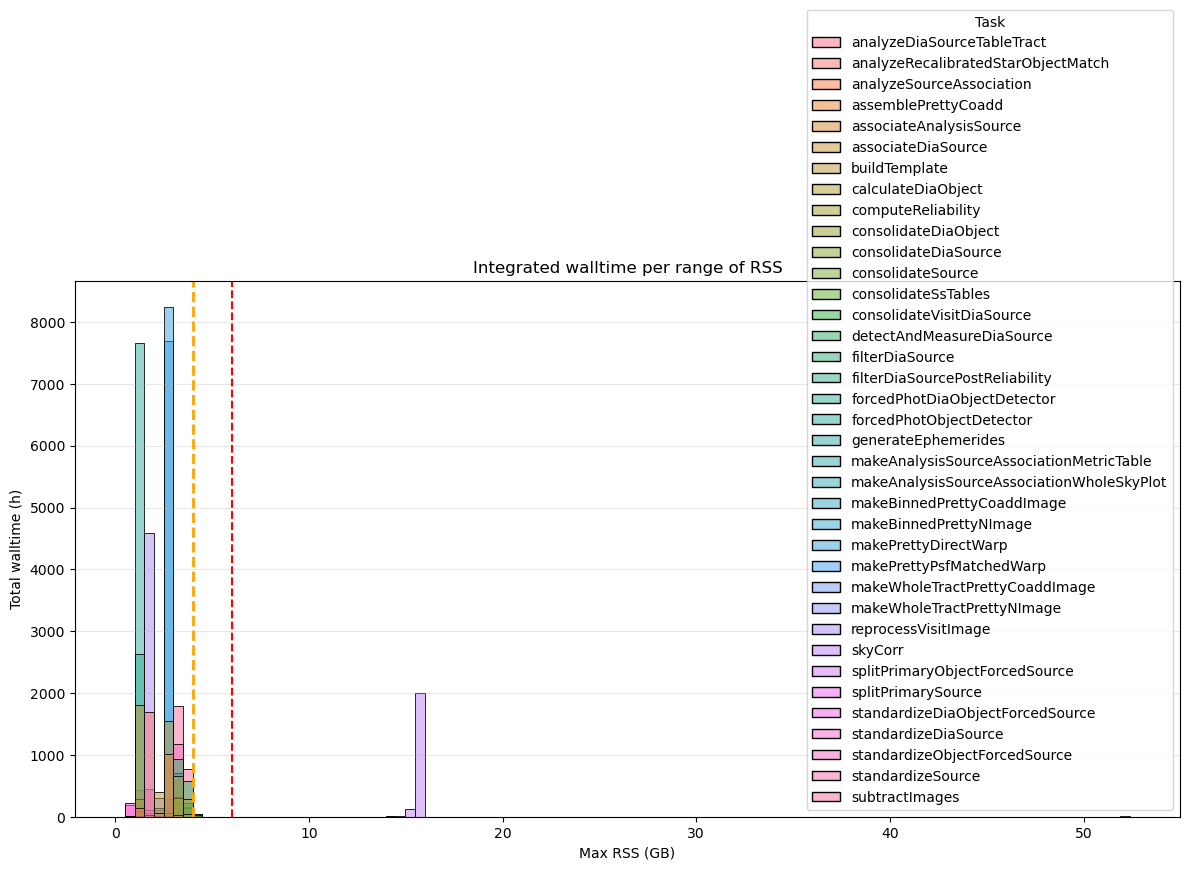
Fig. 24 Integrated wall-time per RSS range for for the DM‑54249 (v30.0.4) Stage 4. Dashed orange and red lines indicate the 4 GB and 6 GB memory thresholds, respectively. Tasks that exceed 6 GB of RSS account for a total of 2 184 h (~4%) of wall-time compared to the 52 124 h of total wall-time.#
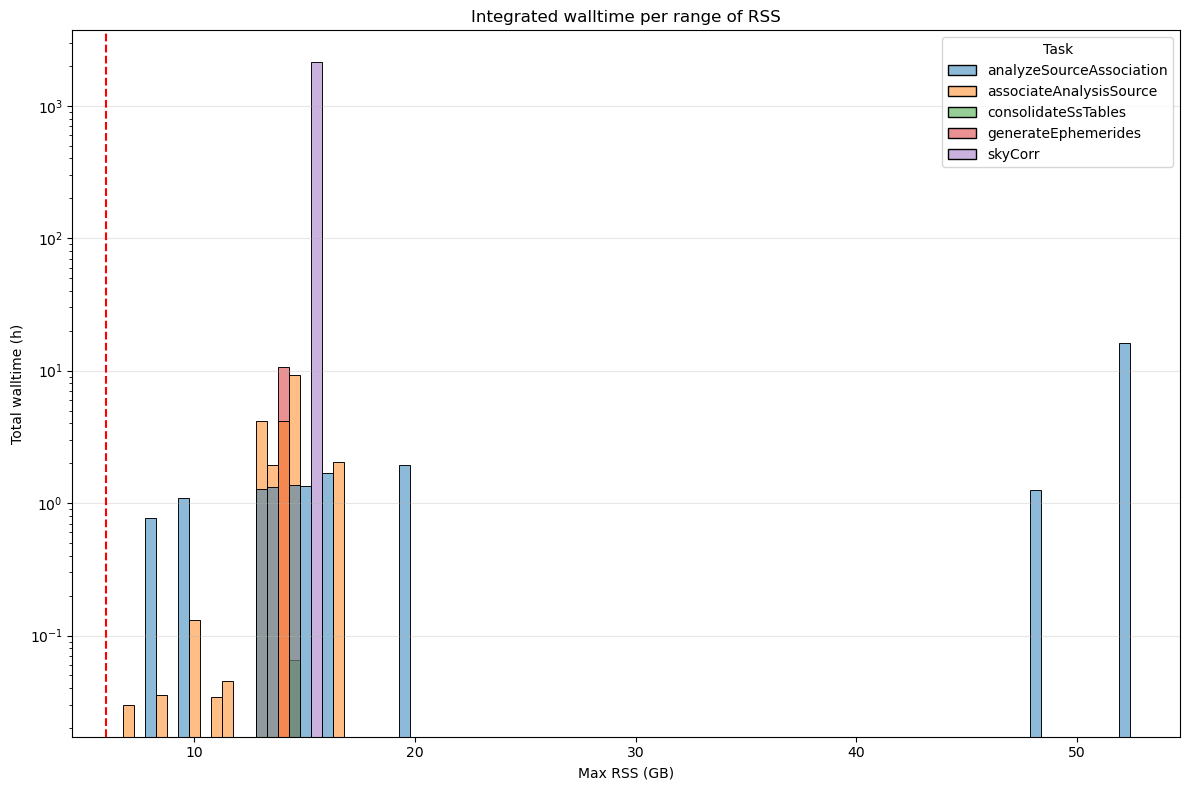
Fig. 25 Integrated wall-time per RSS range for for the DM‑54249 (v30.0.4) Stage 4 processes depassing 6GB. Y-axis in logarithmic scale. Dashed orange and red lines indicate the 4 GB and 6 GB memory thresholds, respectively. Tasks that exceed 6 GB of RSS account for a total of 2 184 h (~4%) of wall-time compared to the 52 124 h of total wall-time.#
4. Conclusion#
The analysis demonstrates that reducing memory allocation to 6 GB per core is feasible for the majority of pipetasks across all stages. Less than 0.3% of quanta exceed the 6 GB threshold, with only a few pipetasks consistently requiring more memory. The cumulative plot in the following figures shows the proportion of pipetasks that consume up to a specified memory threshold (Max RSS). This allows us to evaluate how many pipetasks exceed the critical 6 GB threshold and identify the percentile at which most tasks operate below this threshold.
As shown, 99.9% of pipetasks in Stage 1 use less than 6 GB of memory (Figure 6). Only 0.006% exceed this threshold, indicating that reducing memory allocation to 6 GB per core is feasible for the majority of operations. The green dashed line represents the 95th percentile, which is approximately 3 GB.
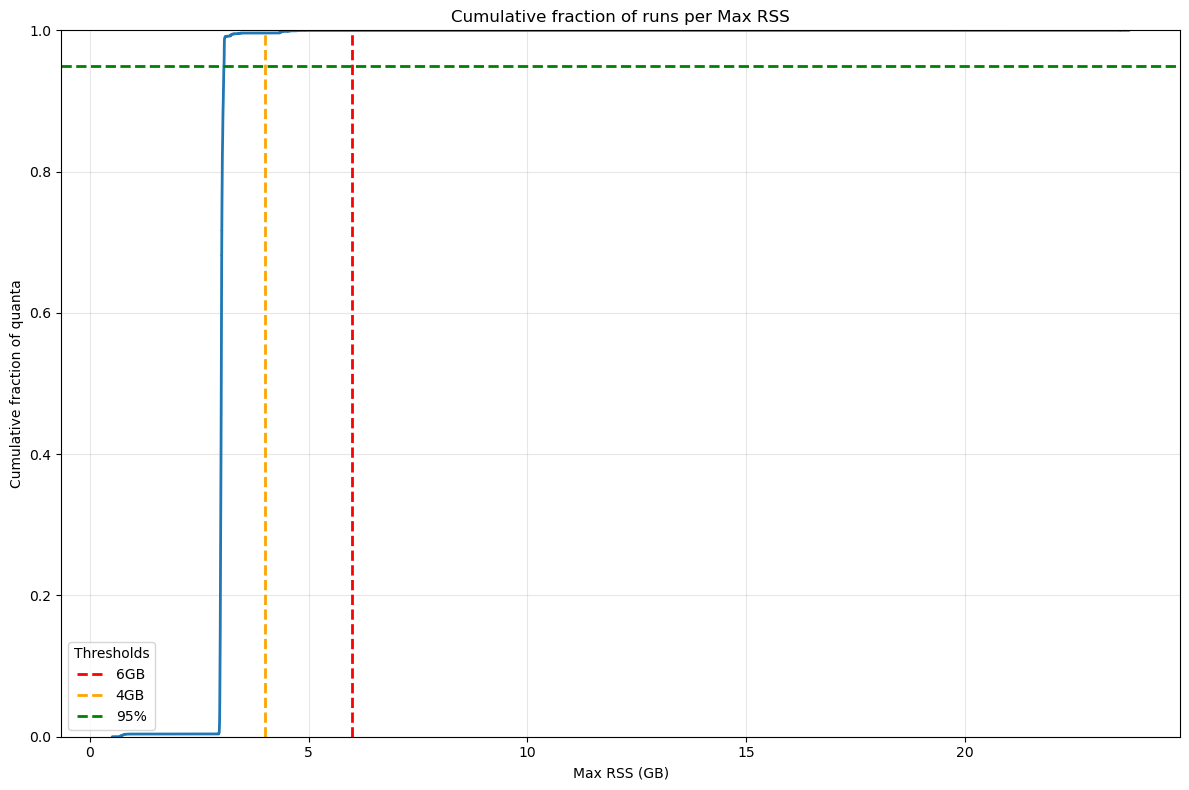
Fig. 26 Cumulative fraction of Stage 1 quanta per Max RSS. The green dashed line represents the 95% of total quanta, dashed orange and red lines indicate the 4 GB and 6 GB memory thresholds. Only 0.006% of quanta exceed the 6GB threshold.#
As shown in the next Figure, 99% of pipetasks in Stage 2 use less than 6 GB of memory (Figure 6). Only 0.3% exceed this threshold, indicating that reducing memory allocation to 6 GB per core is feasible for the majority of operations. However, when we take the wall‑time required by the tasks that exceed the limit into account, the impact in Stage 2 is far from negligible: the few tasks that use more than 6 GB of memory account for roughly 25 % of the total wall‑time, mainly because of the pipetask gaussianProcessesTurbulenceFit. The 95th percentile threshold is approximately 4 GB.
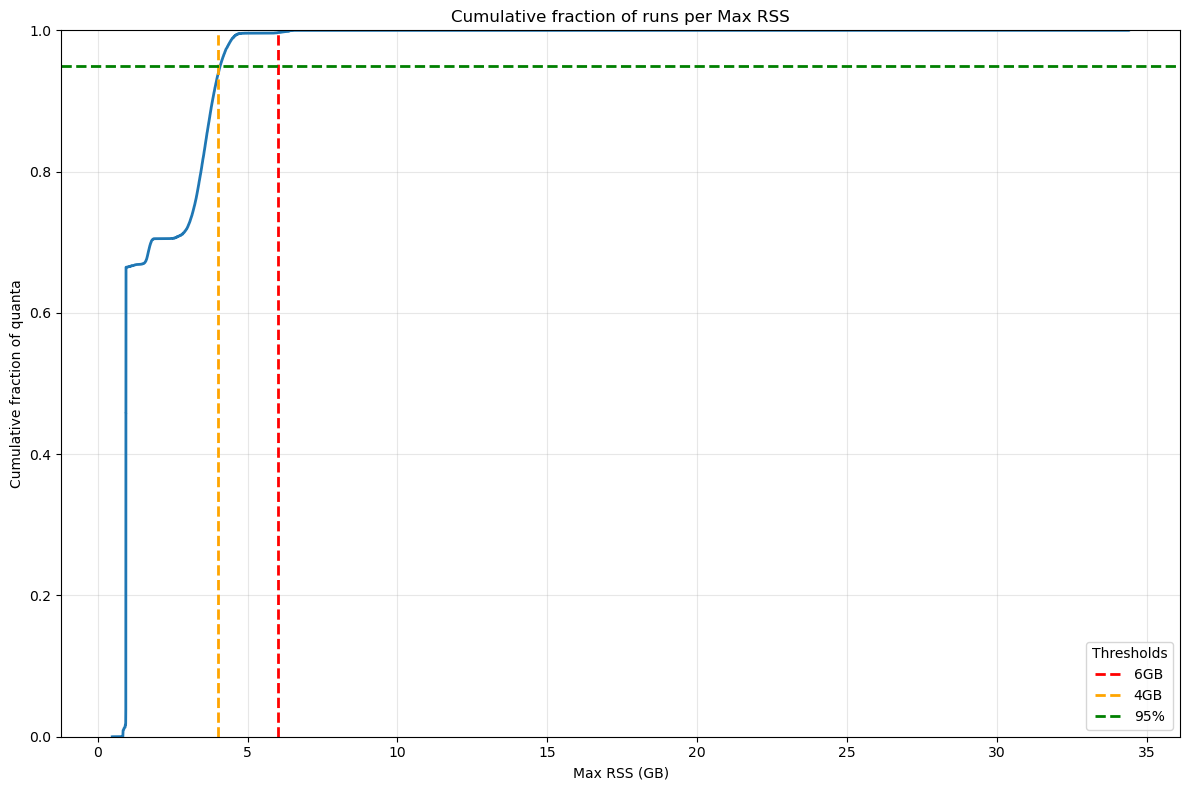
Fig. 27 Cumulative fraction of Stage 2 quanta per Max RSS. The green dashed line represents the 95% of total quanta, dashed orange and red lines indicate the 4 GB and 6 GB memory thresholds. Only 0.3% of quanta exceed the 6GB threshold but these quanta account ~25% of the total wall-time.#
When comparing cumulative plots between Stage 1 and Stage 3 (Figures 26 and 28), Stage 3 shows a slightly higher fraction of pipetasks exceeding 6 GB (0.07% vs. 0.006%). However, the majority of tasks still remain below the critical threshold, supporting the feasibility of a 6 GB per core allocation. Looking at the wall-time, the impact due to quanta exceeding the 6GB threshold is limited to 0.5% of the total wall-time.
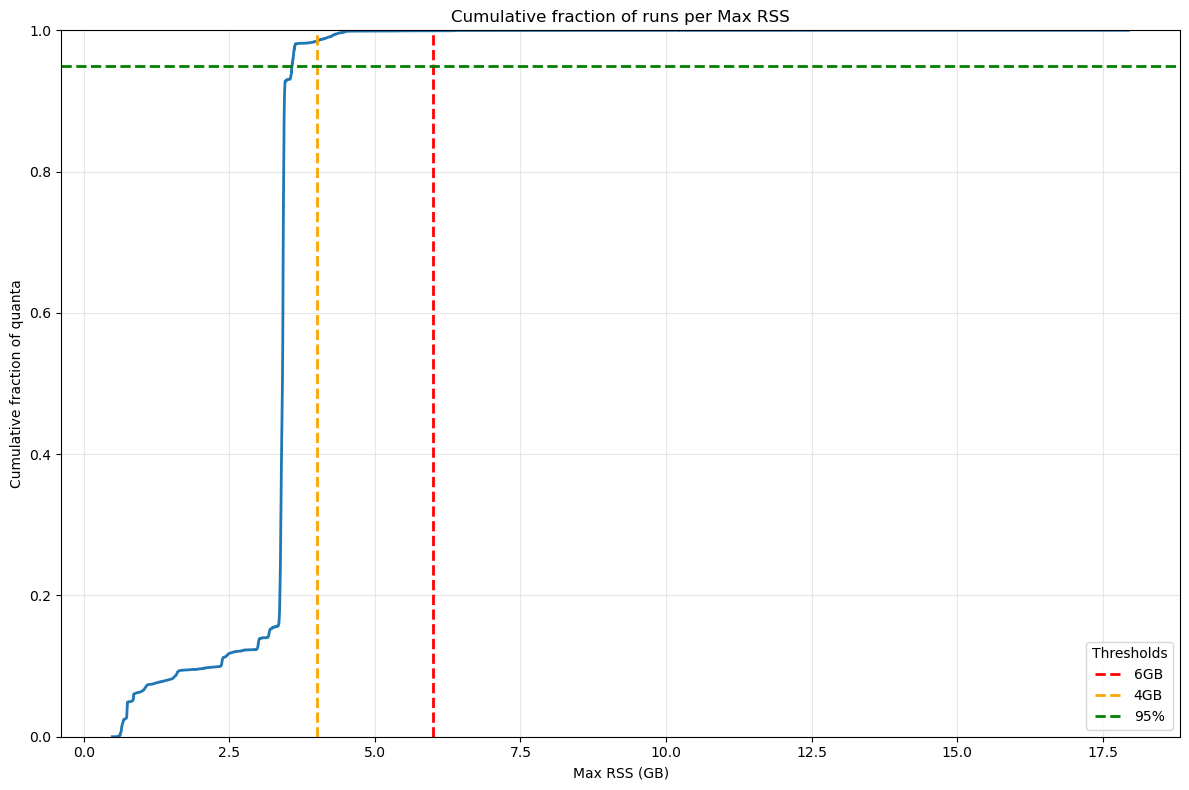
Fig. 28 Cumulative fraction of Stage 3 quanta per Max RSS. The green dashed line represents the 95% of total quanta, dashed orange and red lines indicate the 4 GB and 6 GB memory thresholds.#
Also for Stage 4, the cumulative plots confirm that reducing the memory allocation to 6 GB per core would be sufficient for more than 99 % of the pipetasks, even though the outliers that exceed the memory threshold account for 4 % of the total wall‑time – a contribution that is not negligible.
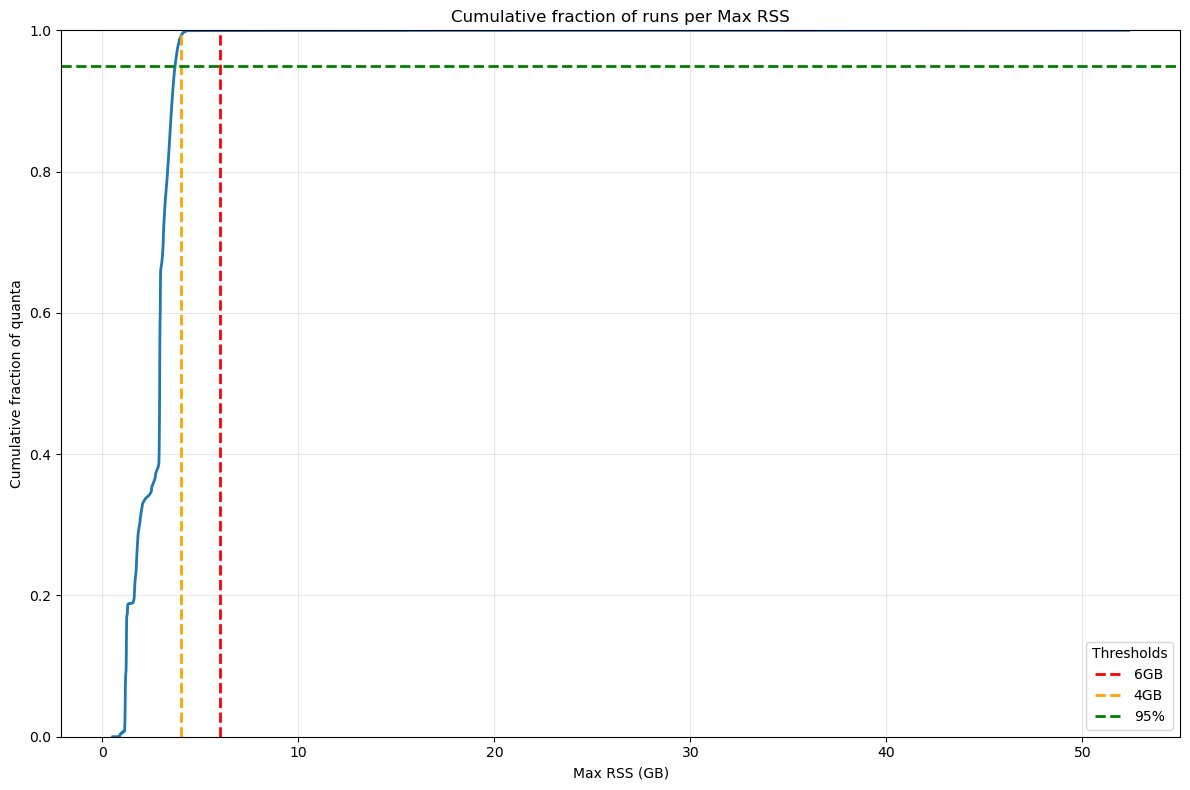
Fig. 29 Cumulative fraction of Stage 4 quanta per Max RSS. The green dashed line represents the 95% of total quanta, dashed orange and red lines indicate the 4 GB and 6 GB memory thresholds.#
The following table presents the number of quanta exceeding the GB threshold for DM‑54249 campaign, indicating that:
Stage 1: 6 GB per core is sufficient for 99.994 % of the quanta in terms of the number of jobs, and for 99.97 % of the quanta in terms of wall-time.
Stage 2: 6 GB per core is sufficient for 99.67 % of the quanta in terms of the number of jobs, and for 75 % of the quanta in terms of wall-time.
Stage 3: 6 GB per core is sufficient for 99.93 % of the quanta in terms of the number of jobs, and for 99.5% of the quanta in terms of wall‑time.
Stage 4: 6 GB per core is sufficient for 99.96 % of the quanta in terms of the number of jobs, and for 96 % of the quanta in terms of wall‑time.
Stage |
Quanta |
N. quanta > 6GB |
% quanta > 6GB |
Total Walltime (h) |
Walltime (h) > 6GB |
% wall-time > 6GB |
|---|---|---|---|---|---|---|
Stage 1 |
574,472 |
36 |
0.006 |
10049.86 |
3.28 |
0.03 |
Stage 2 |
567,886 |
1,916 |
0.337 |
8267.89 |
2077.15 |
25.12 |
Stage 3 |
887,683 |
637 |
0.072 |
25973.91 |
123.53 |
0.476 |
Stage 4 |
2,593,783 |
1,104 |
0.043 |
52124.19 |
2,184.912 |
4.192 |
Annex#
Memory requirement for the dense field SV225#
The analysis of the metrics for the dense field clearly shows a memory demand that exceeds the requirements observed in the previously examined “standard” fields. This excess is visible at every stage of the pipeline, and the extra memory usage made it necessary to adjust the pipeline’s memory configuration in order to process the field in its entirety. In the following sections we will examine, stage by stage, the most problematic tasks
Stage 1 pipetasks#
In DM‑54372 Stage 1, 1,095,651 quanta were executed, and 1,880 of them exceeded the 6 GB threshold (0.18 %). In terms of wall‑time, the quanta that exceeded the 6 GB limit account for roughly 67 h out of a total of 23,143 h (0.3 %).
If this figure looks acceptable, we should still note that the memory requirements are not negligible because two tasks, analyzeSingleVisitStarAssociation and associateIsolatedStar, consume far more memory than they did in the previous campaign as shown in the next table comparing main statistics for these two tasks.
max_rss_mean |
max_rss_median |
max_rss_min |
max_rss_max |
max_rss_95th_percentile |
STACK |
|
|---|---|---|---|---|---|---|
analyzeSingleVisitStarAssociation |
118.055 |
83.6495 |
0.761913 |
307.428 |
303.947 |
v30_0_4_SV225 |
analyzeSingleVisitStarAssociation |
7.602 |
4.24253 |
0.562172 |
23.7612 |
23.6281 |
v30_0_4 |
associateIsolatedStar |
24.3708 |
15.4813 |
0.966152 |
116.038 |
77.878 |
v30_0_4_SV225 |
associateIsolatedStar |
2.93676 |
2.98122 |
0.609653 |
11.0854 |
6.13378 |
v30_0_4 |
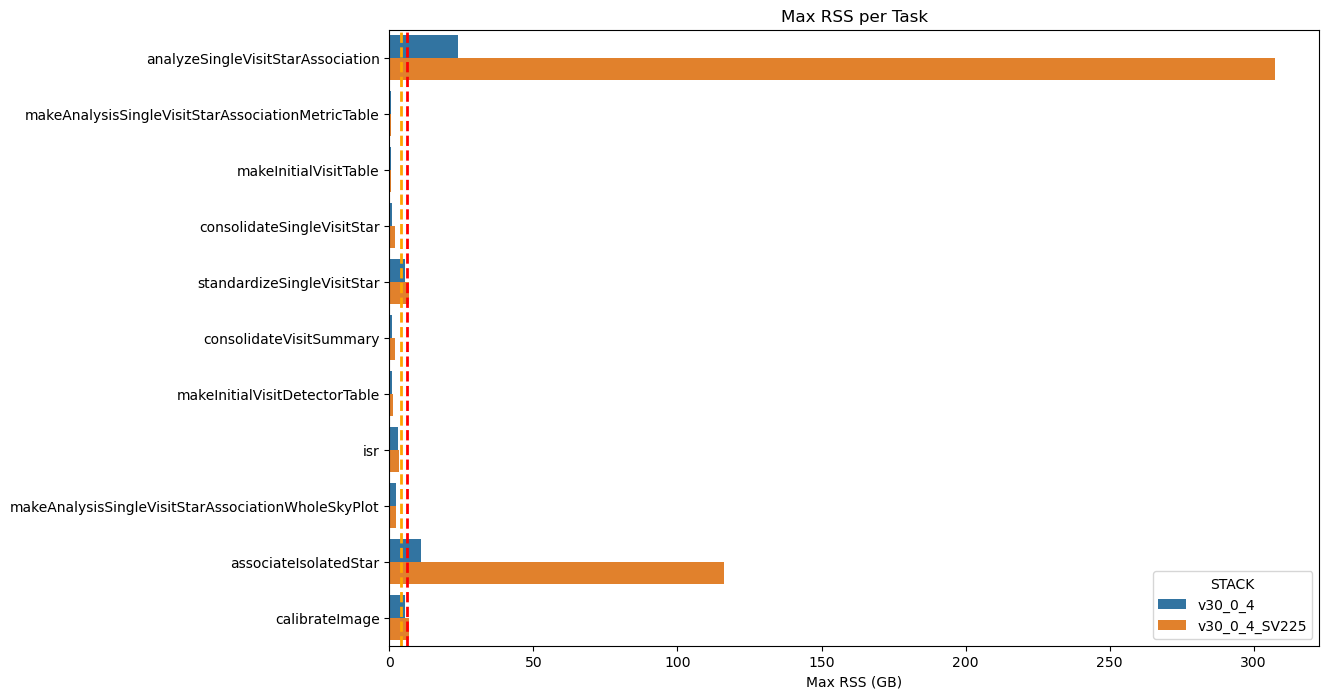
Fig. 30 Maximum RSS of Stage 1 pipeline tasks for dense and non‑dense fields
Dashed orange and red lines indicate the 4 GB and 6 GB memory thresholds. The increase in memory usage is evident for the analyzeSingleVisitStarAssociation and associateIsolatedStar pipeline tasks.#
Also looking at the integrated wall-time, as shown in the next figure, there are jobs using more than 250 GB of memeory for hours.
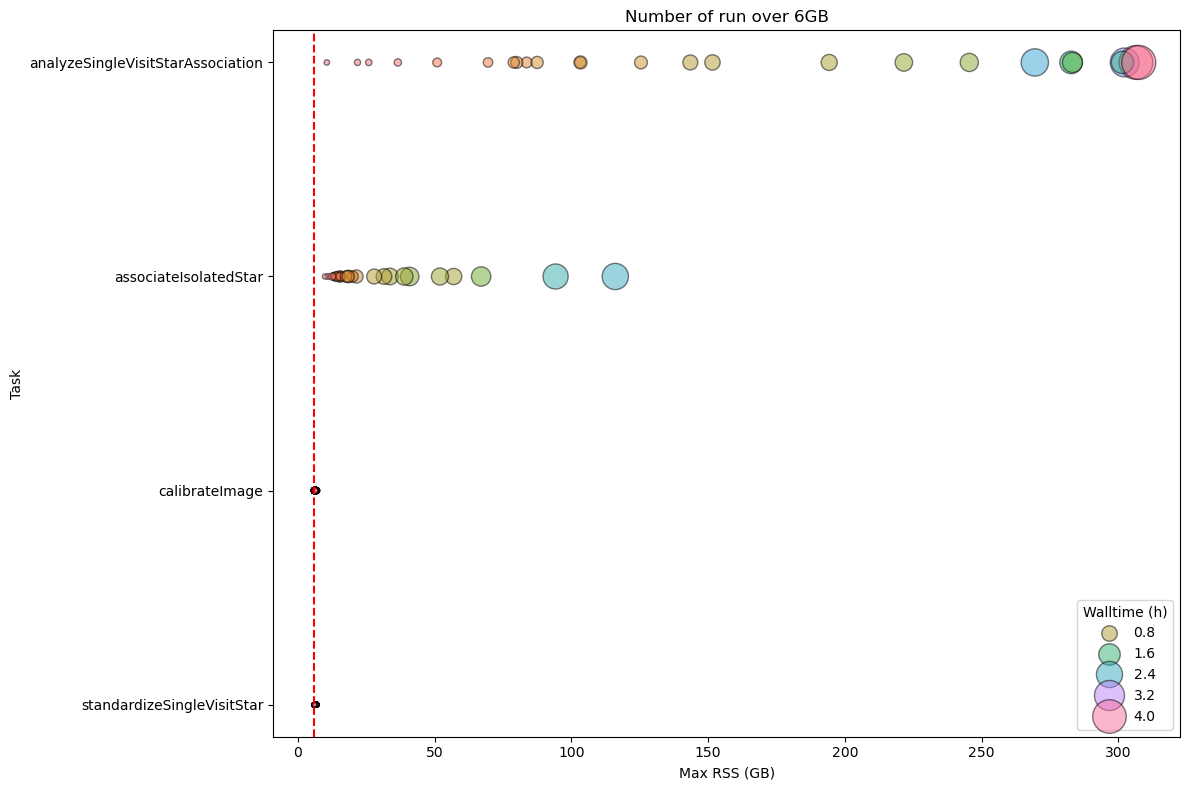
Fig. 31 DM-54372 Stage 1 Pipetask Runs Exceeding the 6 GB Memory Threshold – Frequency and Wall‑time Impact
The plot displays the number of runs (quanta) per Stage 1 pipetask that exceed the 6 GB memory threshold (dashed red line). Each circle marks the frequency (i.e., the number of quanta) at which a given task reaches a specific memory level. The size of the circle is proportional to the wall-time of the quanta, showing that the impact on the cores mobilised to handle the memory excess is important in particular for analyzeSingleVisitStarAssociation and associateIsolatedStar pipetasks.#
Stage 2 pipetasks#
In the case of Stage 2, the situation is more complex: the number of tasks that on average exceed the 6 GB threshold is high both in terms of quanta (288,912 out of a total of 1,071,583, ≈ 27 %) and in terms of cumulative wall‑time (50,123 h out of a total of 60,984 h, ≈ 82 %).
As shown in the following graph, many pipeline tasks executed in Stage 2 use, on average, more than 6 GB of memory.
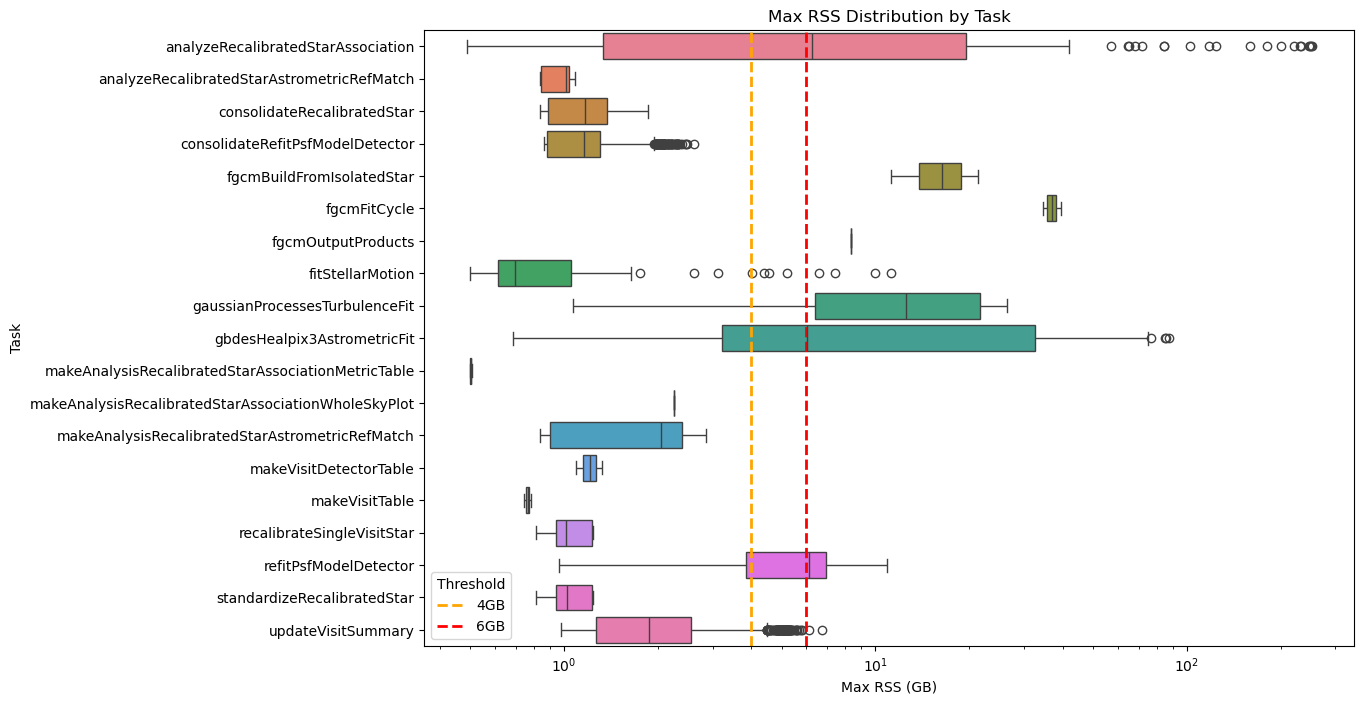
Fig. 32 Box plot showing maximum RSS for Stage 2 pipetasks in v30.0.4 release during DM-54372 SV_225 processing. Orange and red dashed lines indicate the 4 GB and 6 GB memory thresholds. The x‑axis is logarithmic to improve the visualization. Many tasks require > 6GB RSS.#
Some of these pipeline tasks already exceeded the 6 GB threshold in the standard fields, but the overrun is now much larger, with peaks reaching 85 GB (gbdesHealpix3AstrometricFit) and 249 GB (analyzeRecalibratedStarAssociation) as shown in the next graph.
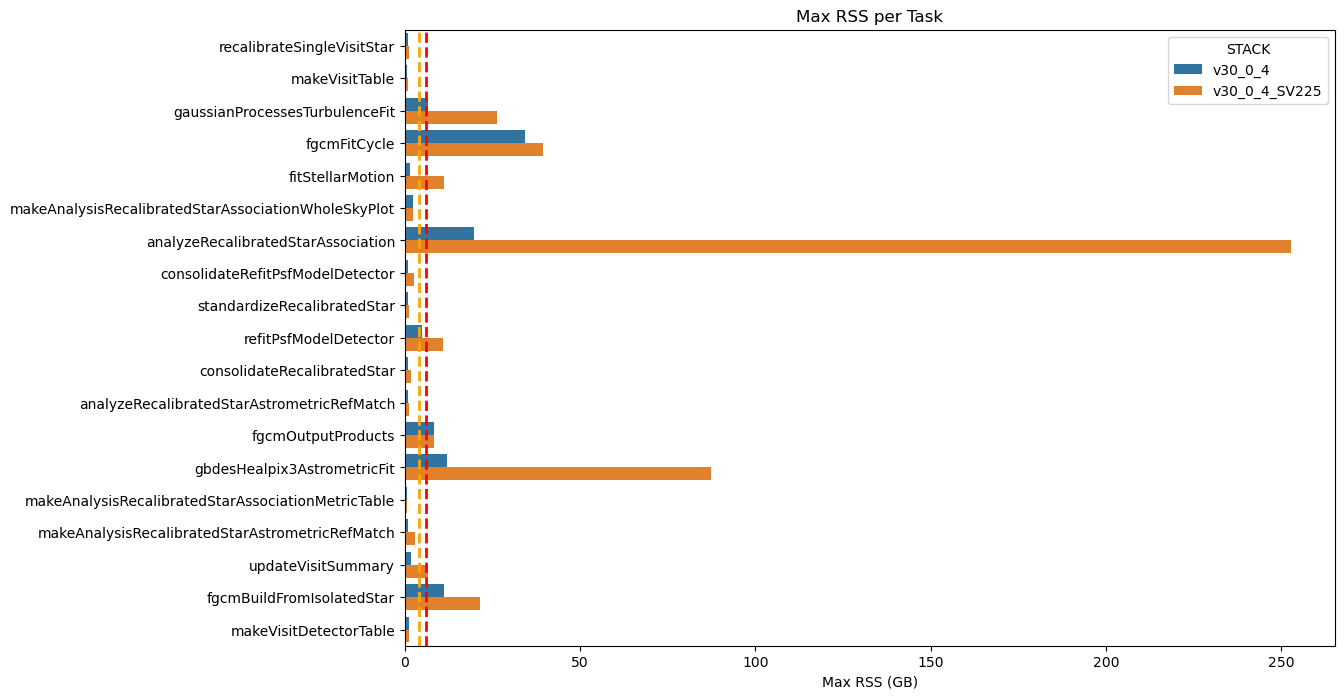
Fig. 33 Maximum RSS of Stage 1 pipeline tasks for dense and non‑dense fields
Dashed orange and red lines indicate the 4 GB and 6 GB memory thresholds. The increase in memory usage is evident for the analyzeSingleVisitStarAssociation and associateIsolatedStar pipetasks.#
The table below shows a comparison of the statistics for the problematic tasks across the two campaigns.
max_rss_mean |
max_rss_median |
max_rss_min |
max_rss_max |
max_rss_95th_percentile |
STACK |
|
|---|---|---|---|---|---|---|
analyzeRecalibratedStarAssociation |
96.702 |
68.4145 |
0.490456 |
252.611 |
249.238 |
v30_0_4_SV225 |
analyzeRecalibratedStarAssociation |
6.52842 |
3.60212 |
0.486923 |
19.7006 |
19.4489 |
v30_0_4 |
fgcmBuildFromIsolatedStar |
21.4124 |
21.4124 |
21.4124 |
21.4124 |
21.4124 |
v30_0_4_SV225 |
fgcmBuildFromIsolatedStar |
11.2081 |
11.2081 |
11.2081 |
11.2081 |
11.2081 |
v30_0_4 |
fgcmFitCycle |
39.3765 |
39.3765 |
39.3765 |
39.3765 |
39.3765 |
v30_0_4_SV225 |
fgcmFitCycle |
34.4069 |
34.4069 |
34.4069 |
34.4069 |
34.4069 |
v30_0_4 |
fgcmOutputProducts |
8.33749 |
8.33749 |
8.33749 |
8.33749 |
8.33749 |
v30_0_4_SV225 |
fgcmOutputProducts |
8.3409 |
8.3409 |
8.3409 |
8.3409 |
8.3409 |
v30_0_4 |
fitStellarMotion |
2.46621 |
1.13275 |
0.500439 |
11.2468 |
8.43619 |
v30_0_4_SV225 |
fitStellarMotion |
0.713758 |
0.656345 |
0.502529 |
1.43505 |
1.09982 |
v30_0_4 |
gaussianProcessesTurbulenceFit |
17.5902 |
18.1526 |
6.38021 |
26.4142 |
26.2845 |
v30_0_4_SV225 |
gaussianProcessesTurbulenceFit |
6.12501 |
6.2077 |
1.07148 |
6.54644 |
6.51897 |
v30_0_4 |
gbdesHealpix3AstrometricFit |
46.5806 |
42.5762 |
8.96418 |
87.3772 |
85.7613 |
v30_0_4_SV225 |
gbdesHealpix3AstrometricFit |
4.73779 |
3.74013 |
0.684643 |
12.0505 |
11.3513 |
v30_0_4 |
refitPsfModelDetector |
6.70917 |
6.79523 |
1.25986 |
10.8903 |
8.33599 |
v30_0_4_SV225 |
refitPsfModelDetector |
3.41789 |
3.56515 |
0.96085 |
4.92125 |
4.36204 |
v30_0_4 |
As shown in the figure below—and as observed in the standard fields—the gaussianProcessesTurbulenceFit pipeline task consistently uses around 6 GB of memory for extended periods. In addition, the gbdesHealpix3AstrometricFit task now consumes up to 85 GB for about 40 h, and the analyzeRecalibratedStarAssociation task reaches 250 GB for many hours.
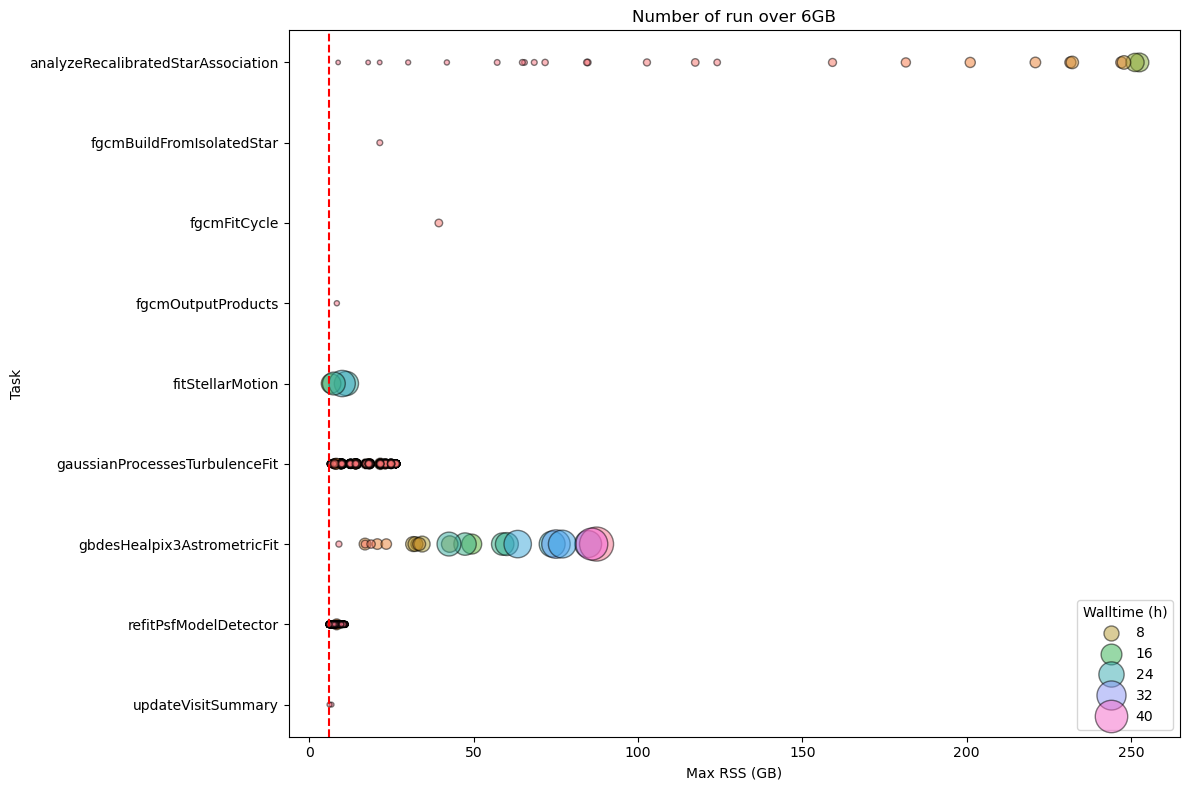
Fig. 34 DM-54372 Stage 2 Pipetask Runs Exceeding the 6 GB Memory Threshold – Frequency and Wall‑time Impact The plot displays the number of runs (quanta) per Stage 2 pipetask that exceed the 6 GB memory threshold (dashed red line). Each circle marks the frequency (i.e., the number of quanta) at which a given task reaches a specific memory level. The size of each circle is proportional to the quanta’s wall‑time, illustrating that the impact on the cores required to handle the memory excess is now substantial for many tasks.#
Stage 3 pipetasks#
Regarding Stage 3, the situation is better than in Stage 2, although, as with dense fields, the number of pipeline tasks and quanta that exceed the 6 GB threshold is higher than for non‑dense fields. For DM‑54372, a total of 2,182,659 quanta were executed; of these, 1,617 (0.07 %) exceeded the 6 GB limit, accounting for 1,074 h of wall‑time out of a total of 76,739 h (1.4 %).
As shown in the graphs below, although some tasks display lower memory peaks when processing dense fields (notably plopPropertyMapSurvey, consolidateObject, etc.), an analysis of the 95th‑percentile memory usage shows that, overall, more memory was required to handle the dense field SV_225.
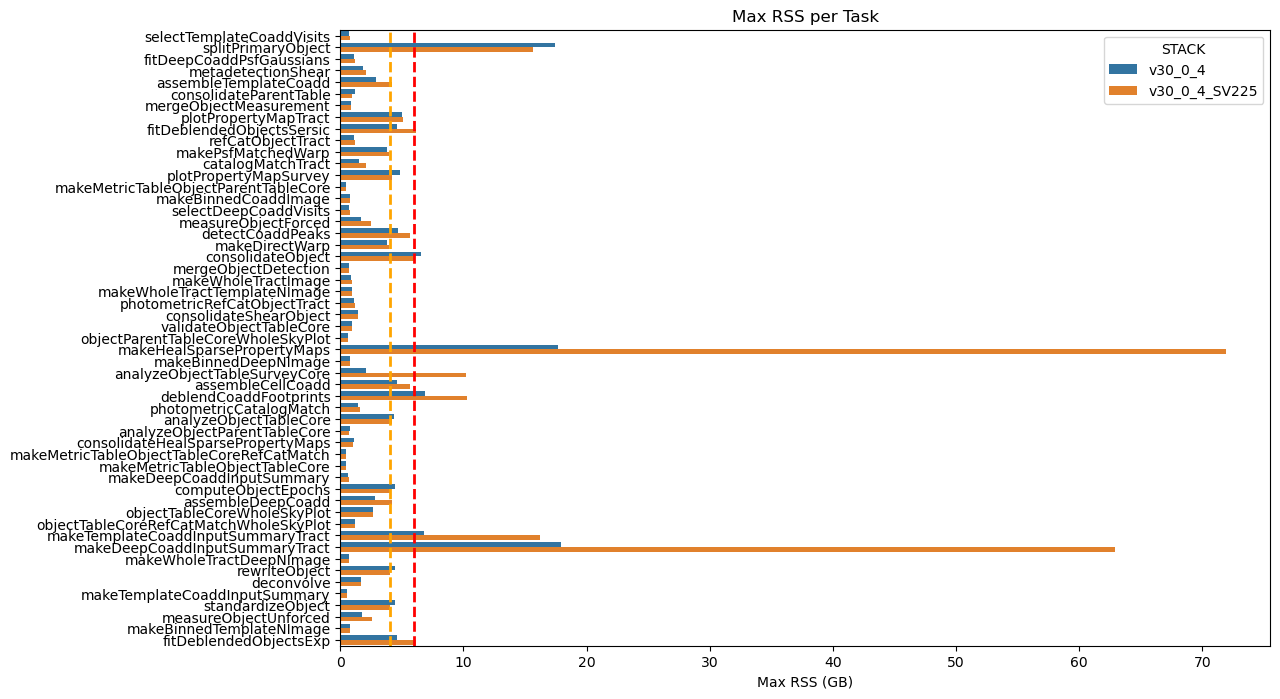
Fig. 35 Maximum RSS of Stage 3 pipeline tasks for dense and non‑dense fields
Dashed orange and red lines indicate the 4 GB and 6 GB memory thresholds. The increase in memory usage is evident for the makeHealSparsePropertvMap and makeDeepCoaddinputSummaryTract pipeline tasks.#
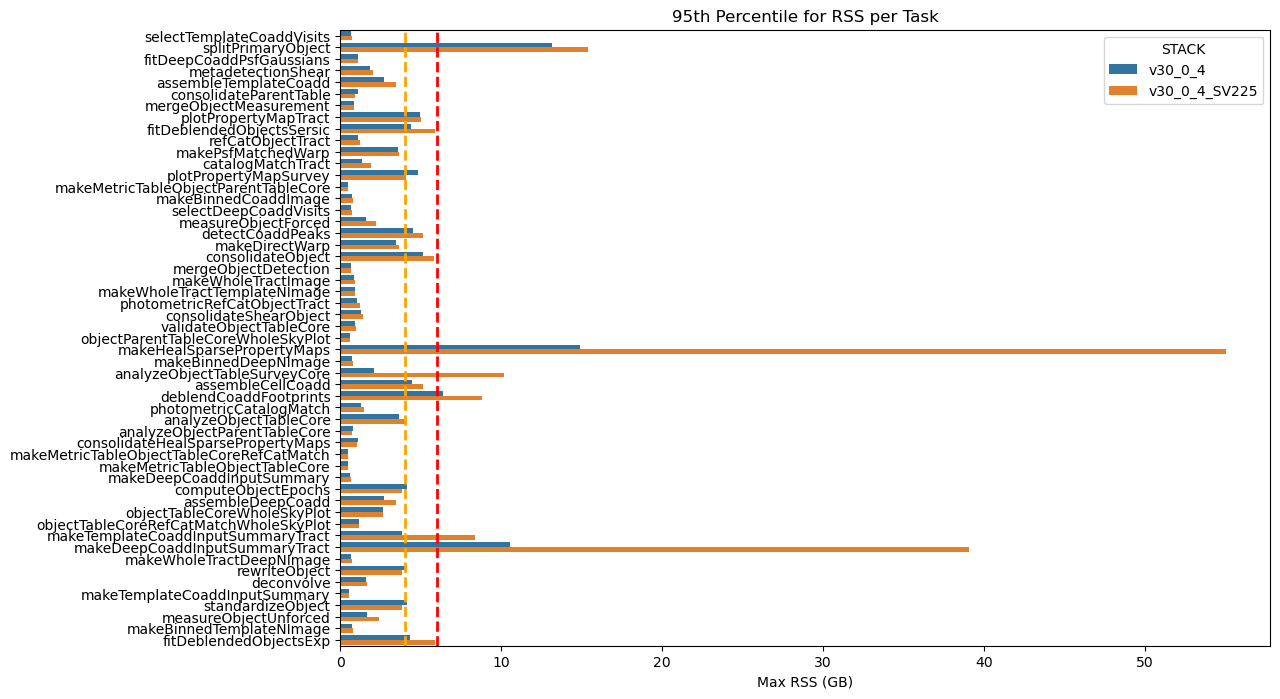
Fig. 36 95th‑percentile of max RSS of Stage 3 pipeline tasks for dense and non‑dense fields
The 95th‑percentile of the RSS values (95 % of pipetasks lie at or below this level). Dashed orange and red lines indicate the 4 GB and 6 GB memory thresholds. The increase in memory usage is evident for the makeHealSparsePropertvMap and makeDeepCoaddinputSummaryTract pipetasks.#
The table below shows a comparison of the statistics for the problematic Stage 3 tasks across the two campaigns.
max_rss_mean |
max_rss_median |
max_rss_min |
max_rss_max |
max_rss_95th_percentile |
STACK |
|
|---|---|---|---|---|---|---|
analyzeObjectTableSurveyCore |
10.172 |
10.172 |
10.172 |
10.172 |
10.172 |
v30_0_4_SV225 |
analyzeObjectTableSurveyCore |
2.06782 |
2.06782 |
2.06782 |
2.06782 |
2.06782 |
v30_0_4 |
makeDeepCoaddInputSummaryTract |
9.67026 |
3.43268 |
0.675789 |
62.9499 |
39.0744 |
v30_0_4_SV225 |
makeDeepCoaddInputSummaryTract |
2.95651 |
0.954704 |
0.665157 |
17.955 |
10.5732 |
v30_0_4 |
makeHealSparsePropertyMaps |
20.7522 |
15.017 |
1.04848 |
71.9303 |
55.0528 |
v30_0_4_SV225 |
makeHealSparsePropertyMaps |
5.72563 |
4.59602 |
1.01052 |
17.6435 |
14.9179 |
v30_0_4 |
splitPrimaryObject |
8.0878 |
8.23914 |
0.644089 |
15.6442 |
15.4146 |
v30_0_4_SV225 |
splitPrimaryObject |
4.38222 |
1.9906 |
0.63155 |
17.4722 |
13.1409 |
v30_0_4 |
As shown in the figure below, many pipetasks consistently use around 6 GB of memory for extended periods, up to 40 h.
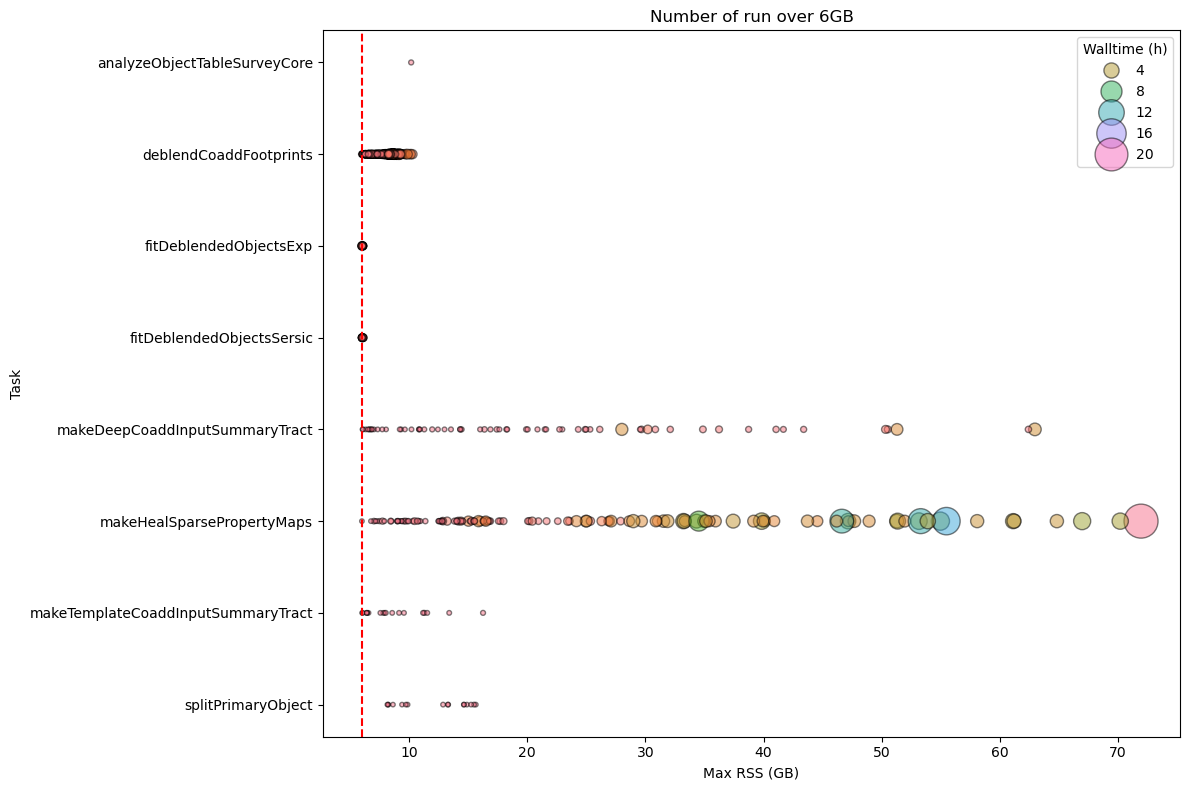
Fig. 37 DM-54372 Stage 3 Pipetask Runs Exceeding the 6 GB Memory Threshold – Frequency and Wall‑time Impact The plot displays the number of runs (quanta) per Stage 3 pipetask that exceed the 6 GB memory threshold (dashed red line). Each circle marks the frequency (i.e., the number of quanta) at which a given task reaches a specific memory level. The size of each circle is proportional to the quanta’s wall‑time, illustrating that the impact on the cores required to handle the memory excess is now substantial for many tasks.#
Stage 4 pipetasks#
Even for the Stage 4 pipetasks we see a significant increase in memory usage, with peaks reaching 450 GB for analyzeSourceAssociation.
For this stage we executed 6,425,437 quanta, of these 42,119 exceeded the 6GB limit (~ 0.7%) accounting for 15,386 h of wall‑time out of a total of 178,482 h (8.62%).
As shown in the graphs below, the 95th‑percentile memory‑usage analysis reveals that the dense field SV_225 consistently required more RAM, especially for the analyseSourceAssociation, consolidateDiaSource, and associateAnalysisSource pipeline tasks.
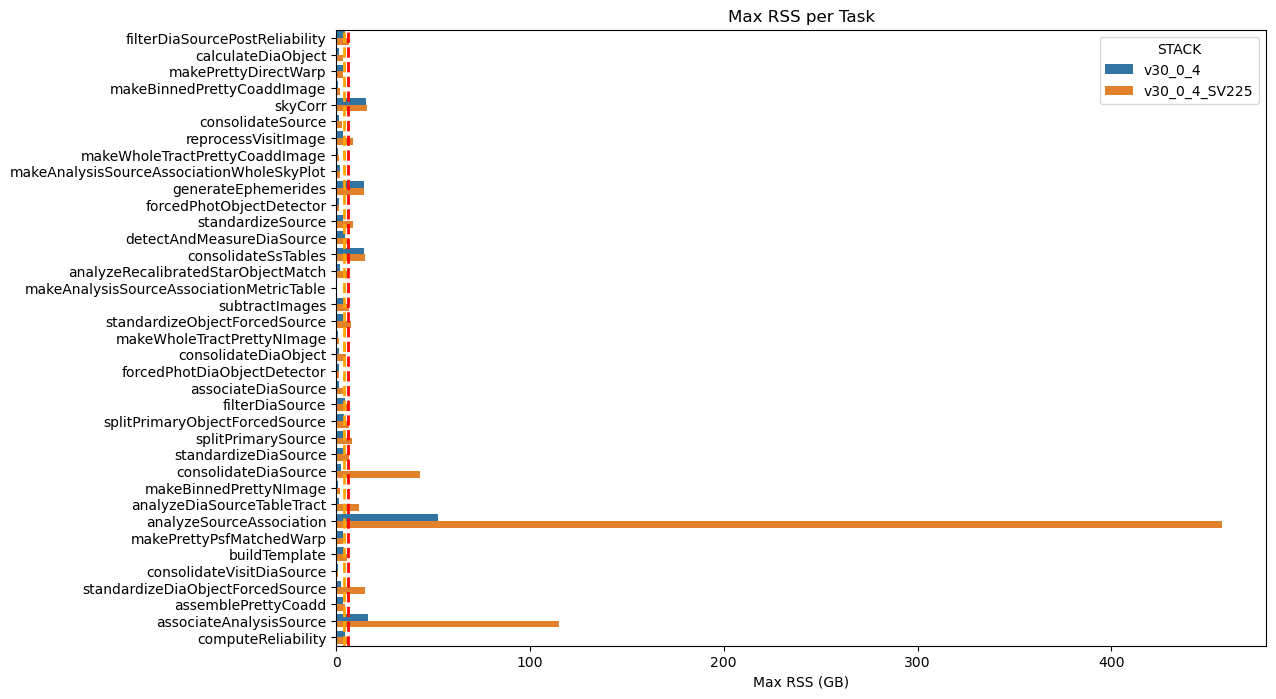
Fig. 38 Maximum RSS of Stage 3 pipeline tasks for dense and non‑dense fields
Dashed orange and red lines indicate the 4 GB and 6 GB memory thresholds. The increase in memory usage is evident for the analyseSourceAssociation, consolidateDiaSource, and associateAnalysisSOurce pipeline tasks.#

Fig. 39 95th‑percentile of max RSS of Stage 4 pipeline tasks for dense and non‑dense fields
The 95th‑percentile of the RSS values (95 % of pipetasks lie at or below this level). Dashed orange and red lines indicate the 4 GB and 6 GB memory thresholds. The increase in memory usage is evident for the analyseSourceAssociation, consolidateDiaSource, and associateAnalysisSOurce pipetasks.#
The table below shows a comparison of the statistics for the problematic Stage 4 tasks across the two campaigns.
max_rss_mean |
max_rss_median |
max_rss_min |
max_rss_max |
max_rss_95th_percentile |
STACK |
|
|---|---|---|---|---|---|---|
analyzeDiaSourceTableTract |
3.40835 |
1.76696 |
1.33379 |
11.8671 |
9.75785 |
v30_0_4_SV225 |
analyzeDiaSourceTableTract |
0.928535 |
0.882538 |
0.873363 |
1.26305 |
1.21465 |
v30_0_4 |
analyzeRecalibratedStarObjectMatch |
6.06886 |
6.10214 |
5.55774 |
6.25974 |
6.19345 |
v30_0_4_SV225 |
analyzeRecalibratedStarObjectMatch |
1.55229 |
1.67764 |
0.998528 |
1.78778 |
1.73491 |
v30_0_4 |
analyzeSourceAssociation |
206.595 |
156.755 |
2.40981 |
456.986 |
451.934 |
v30_0_4_SV225 |
analyzeSourceAssociation |
17.9633 |
5.24598 |
1.0643 |
52.3885 |
52.3016 |
v30_0_4 |
associateAnalysisSource |
44.1646 |
48.9917 |
1.7278 |
115.159 |
90.4585 |
v30_0_4_SV225 |
associateAnalysisSource |
6.26791 |
2.9582 |
1.3198 |
16.5839 |
14.6256 |
v30_0_4 |
consolidateDiaSource |
9.99923 |
4.06018 |
1.33514 |
43.3943 |
34.9344 |
v30_0_4_SV225 |
consolidateDiaSource |
1.12855 |
0.882492 |
0.872929 |
2.60363 |
2.36882 |
v30_0_4 |
standardizeDiaObjectForcedSource |
3.07845 |
1.45218 |
1.32604 |
14.9025 |
10.0145 |
v30_0_4_SV225 |
standardizeDiaObjectForcedSource |
1.00443 |
0.885902 |
0.874744 |
2.47455 |
1.5126 |
v30_0_4 |
standardizeObjectForcedSource |
2.70103 |
1.9294 |
1.32792 |
7.47769 |
6.34357 |
v30_0_4_SV225 |
standardizeObjectForcedSource |
1.38892 |
0.885784 |
0.87326 |
3.62589 |
3.37692 |
v30_0_4 |
standardizeSource |
3.57195 |
3.28986 |
1.82681 |
8.84628 |
5.66682 |
v30_0_4_SV225 |
standardizeSource |
1.82974 |
1.79422 |
1.12519 |
3.61885 |
2.10644 |
v30_0_4 |
The problematic tasks are also time‑consuming, as shown in the figure below, which forces the allocation of additional CPU resources to meet the higher memory demands.
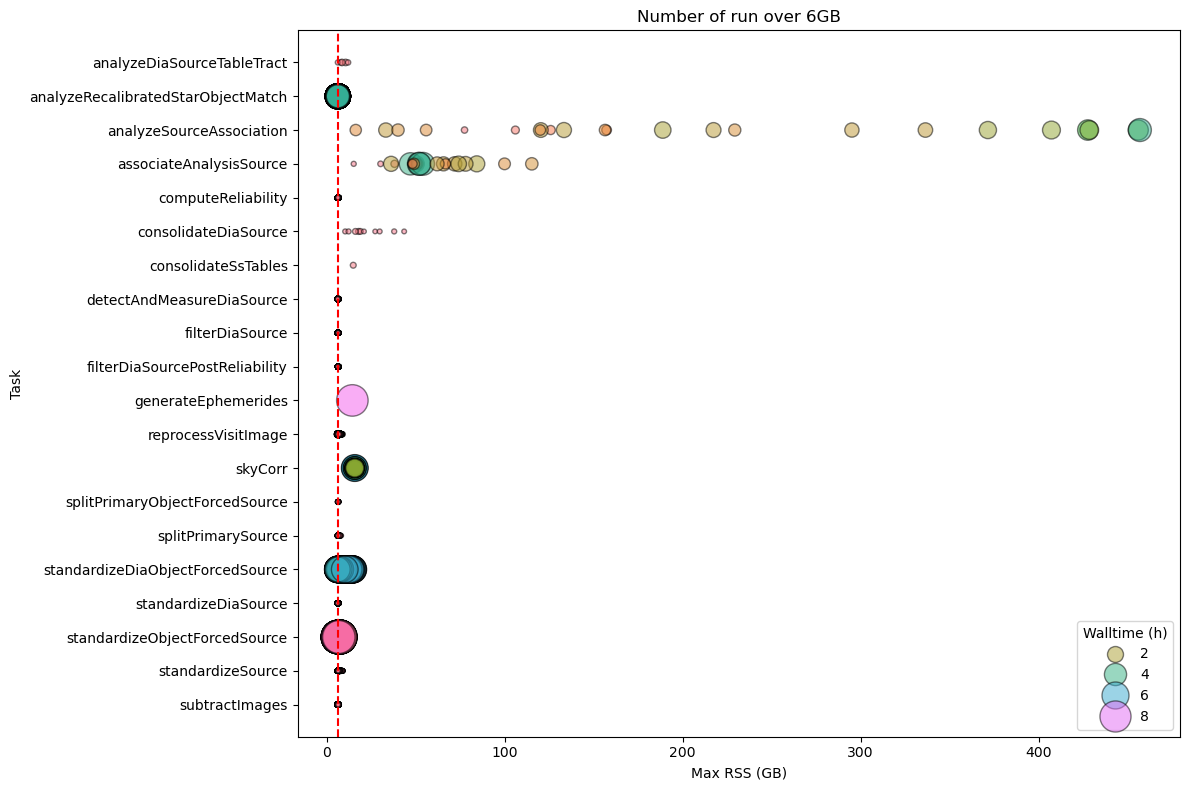
Fig. 40 DM-54372 Stage 4 Pipetask Runs Exceeding the 6 GB Memory Threshold – Frequency and Wall‑time Impact The plot displays the number of runs (quanta) per Stage 3 pipetask that exceed the 6 GB memory threshold (dashed red line). Each circle marks the frequency (i.e., the number of quanta) at which a given task reaches a specific memory level. The size of each circle is proportional to the quanta’s wall‑time, illustrating that the impact on the cores required to handle the memory excess is now substantial for many tasks.#
SV_225 processing conclusions#
The table below summarizes the results for the different stages, showing that, for Stage 2, processing a dense and deep field such as SV_225 may require a non‑negligible increase in memory resources, especially when the time needed for certain problematic pipetasks to finish is taken into account. Also for Stage 4 the memmory increase is not negligeable also in terms of integrated walltime.
The table below summarises the results for the different stages.
Stage 1 - The increase in memory required by the two tasks
analyzeSingleVisitStarAssociationandassociateIsolatedStaris significant, but it has little impact on the integrated wall‑time.Stage 2 – This stage is the most problematic: in fact, processing a dense, deep field such as SV_225 can lead to a non‑negligible increase in memory consumption, coupled with a very high wall‑time, which mobilises a large amount of CPU to satisfy the higher memory demands.
Stage 3 – For this stage we also observe an increase in the memory required by the pipeline tasks, but the impact on the integrated wall‑time is considerably smaller than what we see in Stage 2.
Stage 4 – For this stage we encounter the same problem observed in Stage 2, but its impact on the integrated wall‑time is smaller because the jobs run for a shorter time.
Stage |
Quanta |
N. quanta > 6GB |
% quanta > 6GB |
Total Walltime (h) |
Walltime (h) > 6GB |
% wall-time > 6GB |
|---|---|---|---|---|---|---|
Stage 1 |
1,095,651 |
1,880 |
0.172 |
23,142.842 |
67.186 |
0.29 |
Stage 2 |
1,071,583 |
288,912 |
26.961 |
60,984.435 |
50123.035 |
82.19 |
Stage 3 |
2,182,659 |
1,617 |
0.074 |
76,739.012 |
1,073.987 |
1.4 |
Stage 4 |
6,425,437 |
42,119 |
0.656 |
178,482.496 |
15,385.953 |
8.62 |
Comparison across stacks#
Stage 1 pipetasks#
Fig. 41 Maximum RSS of Stage 1 Pipetasks Across Four Stack Releases The box plot compares the maximum RSS of the Stage 1 pipetask across four software stack releases. The orange and red dashed lines represent the 4GB and 6GB memory thresholds, respectively. The chart clearly demonstrates a significant improvement in memory usage from the older “weekly” stack to the v30 version.#
Stage 2 pipetasks#
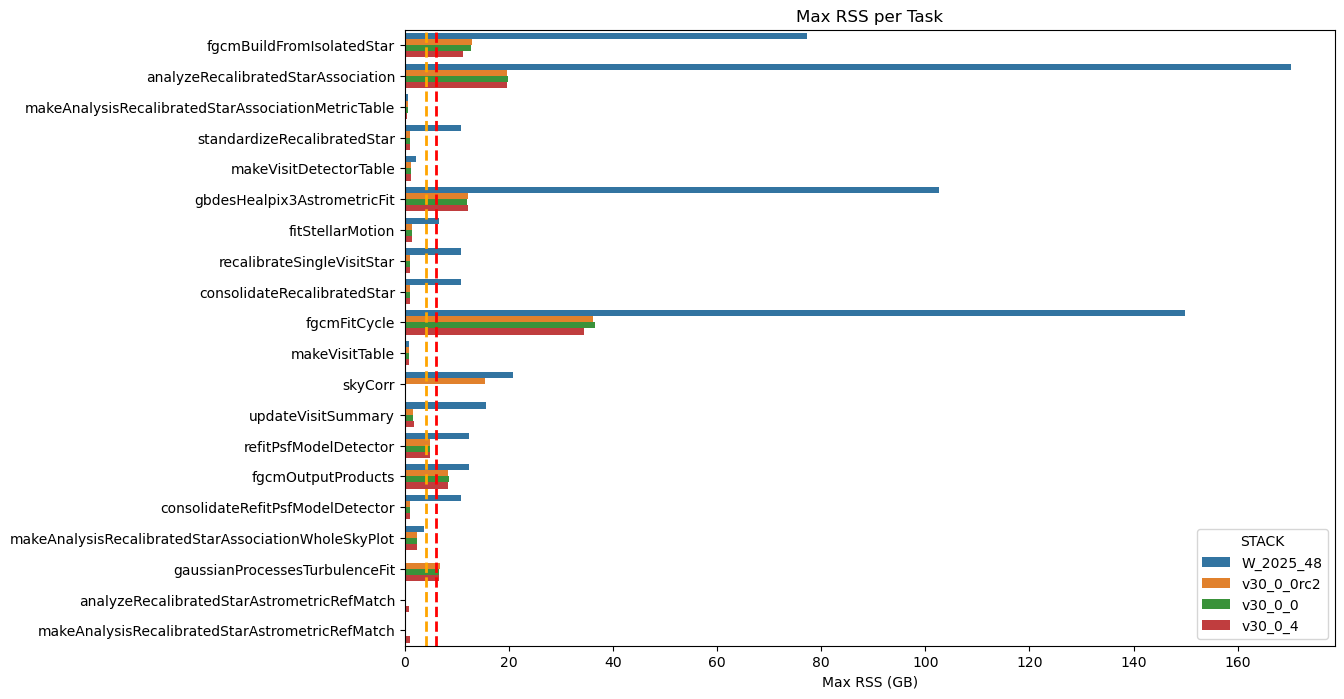
Fig. 42 Maximum RSS of Stage 2 Pipetasks Across Four Stack Releases The box plot compares the maximum RSS of the Stage 2 pipetask across four software stack releases. The orange and red dashed lines represent the 4GB and 6GB memory thresholds, respectively. The chart clearly demonstrates a significant improvement in memory usage from the older “weekly” stack to the v30 version.#
Stage 3 pipetasks#
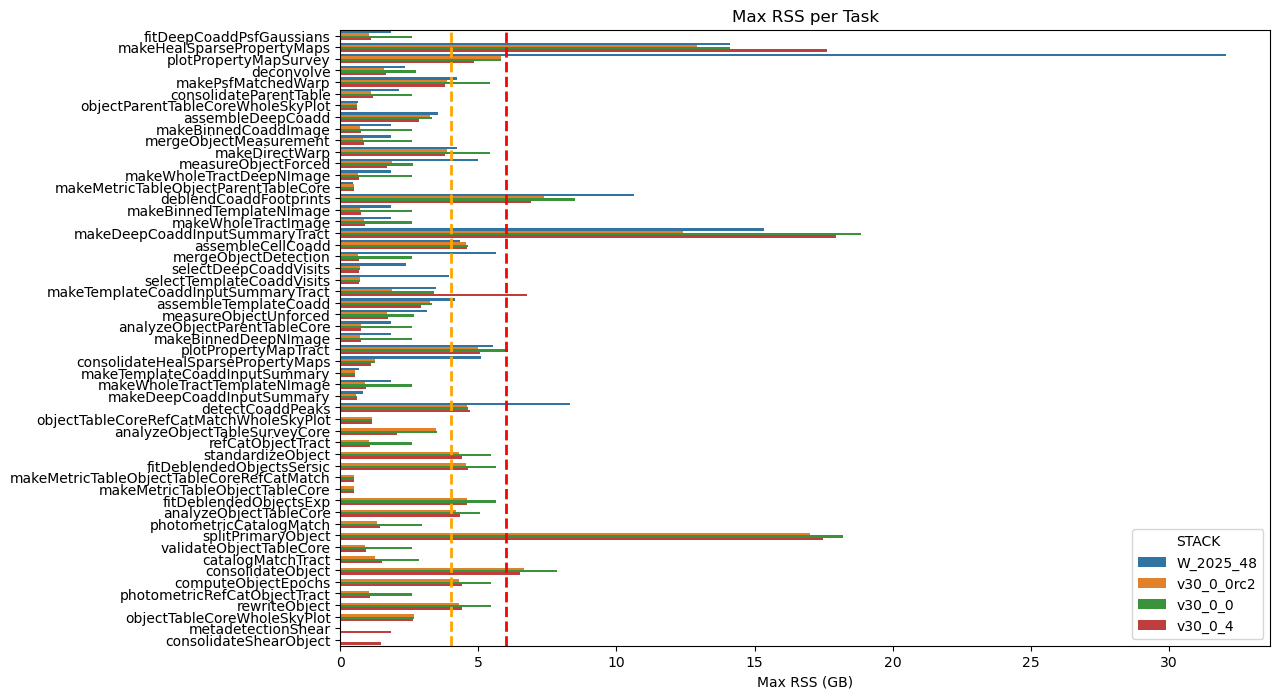
Fig. 43 Maximum RSS of Stage 3 Pipetasks Across Four Stack Releases The box plot compares the maximum RSS of the Stage 3 pipetask across four software stack releases. The orange and red dashed lines represent the 4GB and 6GB memory thresholds, respectively. The chart clearly demonstrates a significant improvement in memory usage from the older “weekly” stack to the v30 version.#
Stage 4 pipetasks#
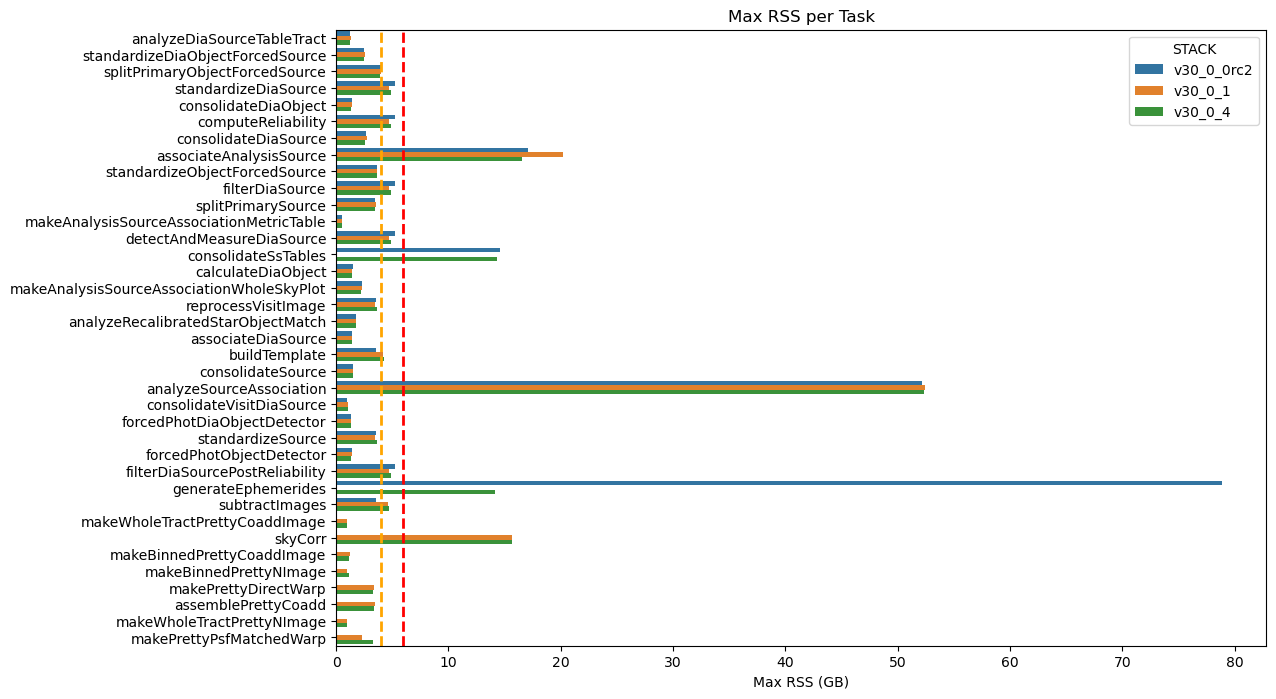
Fig. 44 Maximum RSS of Stage 4 Pipetasks Across Four Stack Releases The box plot compares the maximum RSS of the Stage 4 pipetask across four software stack releases. The orange and red dashed lines represent the 4GB and 6GB memory thresholds, respectively. The chart clearly demonstrates a significant improvement in memory usage from the older “weekly” stack to the v30 version.#
References#
Yusra AlSayyad and William O'Mullane. Data Preview 2: Definition and planning. Technical Note RTN-111, NSF-DOE Vera C. Rubin Observatory, February 2026. URL: https://rtn-111.lsst.io/.
Leanne P. Guy, Keith Bechtol, Eric Bellm, and others. Rubin Observatory Plans for an Early Science Program. Technical Note RTN-011, NSF-DOE Vera C. Rubin Observatory, February 2026. URL: https://rtn-011.lsst.io/, doi:10.71929/rubin/2584021.